
yfinance
Handling Multi-Column Indexes in Pandas Dataframes
It’s a little annoying when an API changes the structure of the data it returns and you end up with your code breaking. In my case, I experienced it when a dataframe having a single column index went to having a multi-column index. This was a new experience for me, at this time, as I hadn’t really come across it before. The following illustrates one particular case similar (not the same) that you might encounter. In this test/demo scenario I’ll be using the yfinance API to illustrate how you can remove the multi-column index and go back to having a single column index.
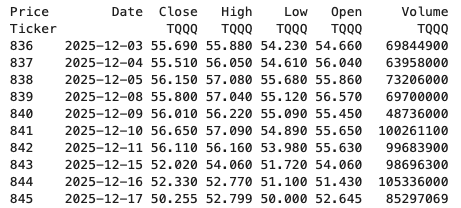
In this demo scenario, we are using yfinance to get data on various stocks. After the data is downloaded we get something like this.
The first step is to do some re-organisation.
df = data.stack(level="Ticker", future_stack=True)
df.index.names = ["Date", "Symbol"]
df = df[["Open", "High", "Low", "Close", "Volume"]]
df = df.swaplevel(0, 1)
df = df.sort_index()
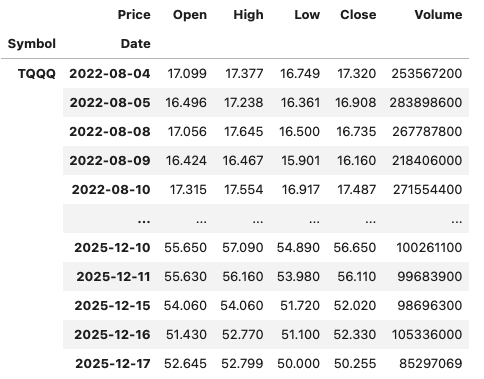
dfThis gives us the data in the following format.
The final part is to extract the data we want by applying a filter.
df.xs(“TQQQ”)
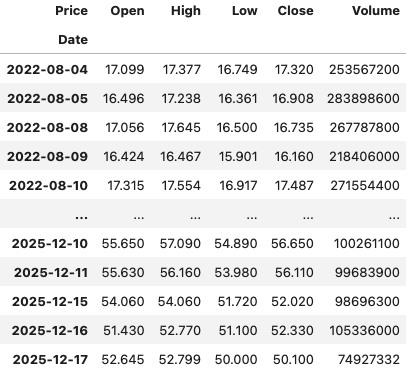
And there we have it.
As I said at the beginning the example above is just to illustrate what you can do.
If this was a real work example of using yfinance, I could just change a parameter setting in the download function, to not use multi_level_index.
data = yf.download(t, start=s_date, interval=time_interval, progress=False, multi_level_index=False)

You must be logged in to post a comment.