
23ai
SQL Firewall – Part 2
In a previous post, we’ve explored some of the core functionality of SQL Firewall in Oracle 23ai, In this post I’ll explore some of the other functionality that I’ve had to use as we’ve deployed SQL Firewall over the past few weeks.
Sometimes, when querying the DBA_SQL_FIREWALL_VIOLATIONS view, you might not get the current up to-date violations, or if you are running it for the first time you might get now rows or violations being returned from the view. This is a slight timing issue, as the violations log/cacbe might not have been persisted to the data dictionary. If you end up in this kind of situation you might need to flush the logs to to data dictionary. To do this, run the following.
exec dbms_sql_firewall.flush_logs;As you work with SQL Firewall on an ongoing basis, where you are turning it on and off at various stages, it can be easy to lose track of whether the Firewall is turned on or off. Being able to check the current status becomes important. To check the currect status, we can query DBA_SQL_FIREWALL_STATUS
select status
from dba_sql_firewall_status;
STATUS
——–
ENABLED
After checking that, we can then run either of the following.
exec dbms_sql_firewall.disable;or
exec dbms_sql_firewall.enableAfter creating your Allowed Lists for your various scenarios, at some point, you might need to add or remove individual statements/queries from a list. An important element for this is to locate the SQL_ID and SQL_SIGNATURE.
exec dbsm_sql_firewall.delete_allowed_sql(username => 'SCOTT', allowed_sql_id => 1);and to add a single statement
exec dbms_sql_firewall.append_allow_list_single_sql(username => 'SCOTT', sql_signature  => '... ... ... ...',
    current_user   => 'PSMITH', top_level      => 'Y',
    source         => DBMS_SQL_FIREWALL.VIOLATION_LOG);
If you are using the Database Scheduler to run jobs, these will keep appearing in the Firewall logs. As these jobs run on a regular basis and new jobs can be added all the time, you will need to manage these. An alternative is to assume these jobs are safe to run. With SQL Firewall the managing of these can be very easy by getting SQL Firewall to ignore them.
exec dbms_sql_firewall.execlude(DBMS_SQL_FIREWALL.SCHEDULAR_JOB);SQL Firewall – Part 1
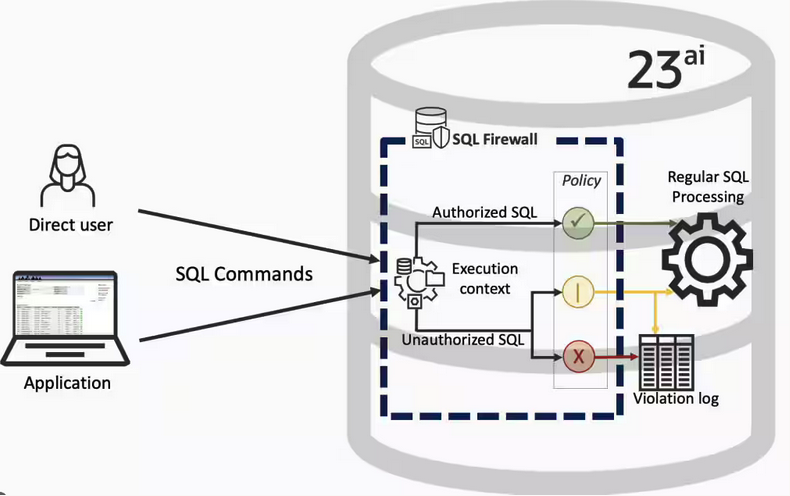
Typically, most IT architectures involve a firewall to act as a barrier, to monitor and to control network traffic. Its aim is to prevent unauthorised access and malicious activity. The firewall enforces rules to allow or block specific traffic (and commands/code). The firewall tries to protect our infrastructure and data. Over time, we have seen examples of how such firewalls have failed. We’ve also seen how our data (and databases) can be attacked internally. There are many ways to access the data and database without using the application. Many different people can have access to the data/database for many different purposes. There has been a growing need to push the idea of and the work of the firewall back to being closer to the data, that is, into the database.
SQL Firewall allows you to implement a firewall within the database to control what commands are allowed to be run on the data. With SQL Firewall you can:
- Monitor the SQL (and PL/SQL) activity to learn what the normal or typical SQL commands are being run on the data
- Captures all commands and logs them
- Manage a list of allowed commands, etc, using Policies
- Block and log all commands that are not allowed. Some commands might be allowed to run
Let’s walk through a simple example of setting this up and using it. For this example I’m assuming you have access to SYSTEM and another schema, for example SCOTT schema with the EMP, DEPT, etc tables.
Step 1 involves enabling SQL Firewall. To do this, we need to connect to the SYS schema and run the function to enable it.
grant sql_firewall_admin to system;Then connect to SYSTEM to enable the firewall.
exec dbms_sql_firewall.enable;For Step 2 we need to turn it on, as in we want to capture some of the commands being performed on the Database. We are using the SCOTT schema, so let’s capture what commands are run in that schema. [remember we are still connected to SYSTEM schema]
begin
  dbms_sql_firewall.create_capture (
    username=>'SCOTT',
    top_level_only=>true);
end;
Now that SQL Firewall is running, Step 3, we can switch to and connect to the SCOTT schema. When logged into SCOTT we can run some SQL commands on our tables.
select * from dept;
select deptno, count(*) from emp group by deptno;
select * from emp where job = 'MANAGER';
For Step 4, we can log back into SYSTEM and stop the capture of commands.
exec dbms_sql_firewall.stop_capture('SCOTT');We can then use the dictionary view DBA_SQL_FIREWALL_CAPTURE_LOG to see what commands were captured and logged.
column command_type format a12
column current_user format a15
column client_program format a45
column os_user format a10
column ip_address format a10
column sql_text format a30

select command_type,
       current_user,
       client_program,
       os_user,
       ip_address,
       sql_text
from   dba_sql_firewall_capture_logs
where  username = 'SCOTT';
The screen isn’t wide enough to display the results, but if you run the above command, you’ll see the three SELECT commands we ran above.
Other SQL Firewall dictionary views include DBA_SQL_FIREWALL_ALLOWED_IP_ADDR, DBA_SQL_FIREWALL_ALLOWED_OS_PROG, DBA_SQL_FIREWALL_ALLOWED_OS_USER and DBA_SQL_FIREWALL_ALLOWED_SQL.
For Step 5, we want to say that those commands are the only commands allowed in the SCOTT schema. We need to create an allowed list. Individual commands can be added, or if we want to add all the commands captured in our log, we can simple run
exec dbms_sql_firewall.generate_allow_list ('SCOTT');
exec  dbms_sql_firewall.enable_allow_list (username=>'SCOTT',block=>true);
Step 6 involves testing to see if the generated allowed list for SQL Firewall work. For this we need to log back into SCOTT schema, and run some commands. Let’s start with the three previously run commands. These should run without any problems or errors.
select * from dept;
select deptno, count(*) from emp group by deptno;
select * from emp where job = 'MANAGER';
Now write a different query and see what is returned.
select count(*) from dept;

Error starting at line : 1 in command -
select count(*) from dept
*
ERROR at line 1:
ORA-47605: SQL Firewall violation
Our new SQL command has been blocked. Which is what we wanted.
As an Administrator of the Database (DBA) you can monitor for violations of the Firewall. Log back into SYSTEM and run the following.
set lines 150
column occurred_at format a40

select sql_text,
       firewall_action,
       ip_address,
       cause,
       occurred_at
from   dba_sql_firewall_violations
where  username = 'SCOTT';

SQL_TEXT		       FIREWAL IP_ADDRESS CAUSE 	    OCCURRED_AT
------------------------------ ------- ---------- ----------------- ----------------------------------------
SELECT COUNT (*) FROM DEPT     Blocked 10.0.2.2   SQL violation     18-SEP-25 06.55.25.059913 PM +00:00
If you decide this command is ok to be run in the schema, you can add it to the allowed list.
exec dbms_sql_firewall.append_allow_list('SCOTT', dbms_sql_firewall.violation_log);The example above gives you the steps to get up and running with SQL Firewall. But there is lots more you can do with SQL Firewall, from monitoring of commands etc, to managing violations, to managing the logs, etc. Check out my other post covering some of these topics.
SQL History Monitoring
New in Oracle 23ai is a feature to allow tracking and monitoring the last 50 queries per session. Previously, we had other features and tools for doing this, but with SQL History we have some of this information in one location. SQL History will not replace what you’ve been using previously, but is just another tool to assist you in your monitoring and diagnostics. Each user can access their own current session history, while SQL and DBAs can view the history of all current user sessions.
If you want to use it, a user with ALTER SYTEM privilege must first change the initialisation parameter SQL_HISTORY_ENABLED instance wide to TRUE in the required PDB. The default is FALSE.
To see if it is enabled.
SELECT name,
       value,
       default_value,
       isdefault
FROM  v$parameter
WHERE name like 'sql_hist%';

NAME                 VALUE      DEFAULT_VALUE             ISDEFAULT
-------------------- ---------- ------------------------- ----------
sql_history_enabled  FALSE      FALSE                     TRUE
In the above example, the parameter is not enabled.
To enable the parameter, you need to do so using a user with SYSTEM level privileges. Use the ALTER SYSTEM privilege to enable it. For example,
alter system set sql_history_enabled=true scope=both;When you connect back to your working/developer schema you should be able to see the parameter has been enabled.
connect student/Password!@DB23

show parameter sql_history_enabled

NAME                            TYPE        VALUE
------------------------------- ----------- ------------------------------
sql_history_enabled             boolean     TRUE
A simple test to see it is working is to query the DUAL table
SELECT sysdate;

SYSDATE
---------
11-JUL-25
1 row selected.

SQL> select XYZ from dual;
select XYZ from dual
 *
ERROR at line 1:
ORA-00904: "XYZ": invalid identifier
Help: https://docs.oracle.com/error-help/db/ora-00904/
When we query the V$SQL_HISTORY view we get.
SELECT sql_text,
       error_number
FROM v$sql_history;

SQL_TEXT                                                ERROR_NUMBER
------------------------------------------------------- ------------
SELECT DECODE(USER, 'XS$NULL',  XS_SYS_CONTEXT('XS$SESS            0
SELECT sysdate                                                     0
SELECT xxx FROM dual                                             904
[I’ve truncated the SQL_TEXT above to fit on one line. By default, only the first 100 characters of the query are visible in this view]
This V$SQL_HISTORY view becomes a little bit more interesting when you look at some of the other columns that are available. in addition to the basic information for each statement like CON_ID, SID, SESSION_SERIAL#, SQL_ID and PLAN_HASH_VALUE, there are also lots of execution statistics like ELAPSED_TIME, CPU_TIME, BUFFER_GETS or PHYSICAL_READ_REQUESTS, etc. which will be of most interest.
The full list of columns is.
DESC v$sql_history

Name                                       Null?    Type
------------------------------------------ -------- -----------------------
 KEY                                                NUMBER
 SQL_ID                                             VARCHAR2(13)
 ELAPSED_TIME                                       NUMBER
 CPU_TIME                                           NUMBER
 BUFFER_GETS                                        NUMBER
 IO_INTERCONNECT_BYTES                              NUMBER
 PHYSICAL_READ_REQUESTS                             NUMBER
 PHYSICAL_READ_BYTES                                NUMBER
 PHYSICAL_WRITE_REQUESTS                            NUMBER
 PHYSICAL_WRITE_BYTES                               NUMBER
 PLSQL_EXEC_TIME                                    NUMBER
 JAVA_EXEC_TIME                                     NUMBER
 CLUSTER_WAIT_TIME                                  NUMBER
 CONCURRENCY_WAIT_TIME                              NUMBER
 APPLICATION_WAIT_TIME                              NUMBER
 USER_IO_WAIT_TIME                                  NUMBER
 IO_CELL_UNCOMPRESSED_BYTES                         NUMBER
 IO_CELL_OFFLOAD_ELIGIBLE_BYTES                     NUMBER
 SQL_TEXT                                           VARCHAR2(100)
 PLAN_HASH_VALUE                                    NUMBER
 SQL_EXEC_ID                                        NUMBER
 SQL_EXEC_START                                     DATE
 LAST_ACTIVE_TIME                                   DATE
 SESSION_USER#                                      NUMBER
 CURRENT_USER#                                      NUMBER
 CHILD_NUMBER                                       NUMBER
 SID                                                NUMBER
 SESSION_SERIAL#                                    NUMBER
 MODULE_HASH                                        NUMBER
 ACTION_HASH                                        NUMBER
 SERVICE_HASH                                       NUMBER
 IS_FULL_SQLTEXT                                    VARCHAR2(1)
 ERROR_SIGNALLED                                    VARCHAR2(1)
 ERROR_NUMBER                                       NUMBER
 ERROR_FACILITY                                     VARCHAR2(4)
 STATEMENT_TYPE                                     VARCHAR2(5)
 IS_PARALLEL                                        VARCHAR2(1)
 CON_ID                                             NUMBER
You must be logged in to post a comment.