
OpenCV
Image Augmentation (Pencil & Cartoon) with OpenCV #SYM42
OpenCV has been with us for over two decades and provides us with a rich open-source library for performing image processing.
In this post I’m going to illustrate how you can use it to convert images (of people) into pencil sketches and cartoon images. As with most examples you find on such technologies there are things it is good at and some things this isn’t good at. Using the typical IT phrase, “It Depends” comes into play with image processing. What might work with one set of images, might not work as well with others.
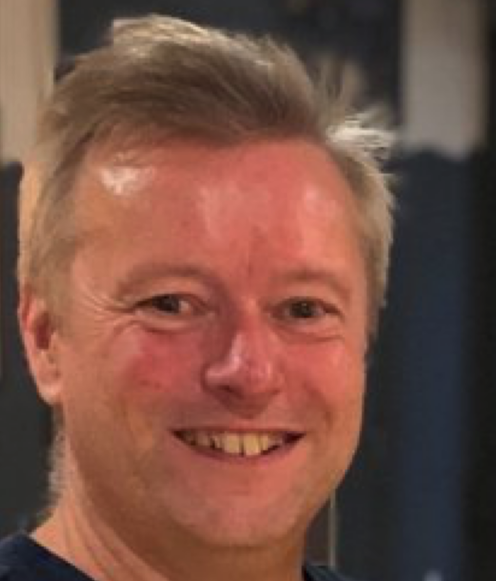
The example images below consist of the Board of a group called SYM42, or Symposium42. Yes, they said I could use their images and show the output from using OpenCV 🙂 This group was formed by a community to support the community, was born out of an Oracle Community but is now supporting other technologies. They are completely independent of any Vendor which means they can be 100% honest about which aspects of any product do or do not work and are not influenced by the current sales or marketing direction of any company. Check out their About page.
Let’s get started. After downloading the images to process, let’s view them.
import cv2
import matplotlib.pyplot as plt
import numpy as np

dir = '/Users/brendan.tierney/Dropbox/6-Screen-Background/'
file = 'SYM42-Board-Martin.jpg'

image = cv2.imread(dir+file)
img_name = 'Original Image'
#Show the image with matplotlib
#plt.imshow(image)

#OpenCV uses BGR color scheme whereas matplotlib uses RGB colors scheme
#convert BGR image to RGB by using the following
plt.imshow(cv2.cvtColor(image, cv2.COLOR_BGR2RGB))
plt.axis(False)
plt.show()
I’m using Jupyter Notebooks for this work. In the above code, you’ll see I’ve commented out the line [#plt.imshow(image)]. This comment doesn’t really work in Jupyter Notebooks and instead you need to swap to using Matplotlib to display the images
To convert to a pencil sketch, we need to convert to pencil sketch, apply a Gaussian Blur, invert the image and perform bit-wise division to get the final pencil sketch.
#convert to grey scale
#cvtColor function
grey_image = cv2.cvtColor(image, cv2.COLOR_BGR2GRAY)
#invert the image
invert_image = cv2.bitwise_not(grey_image)

#apply Gaussian Blue : adjust values until you get pencilling effect required
blur_image=cv2.GaussianBlur(invert_image, (21,21),0)  #111,111

#Invert Blurred Image
#Repeat previous step
invblur_image=cv2.bitwise_not(blur_image)

#The sketch can be obtained by performing bit-wise division between
# the grayscale image and the inverted-blurred image.
sketch_image=cv2.divide(grey_image, invblur_image, scale=256.0)

#display the pencil sketch
plt.imshow(cv2.cvtColor(sketch_image, cv2.COLOR_BGR2RGB))
plt.axis(False)
plt.show()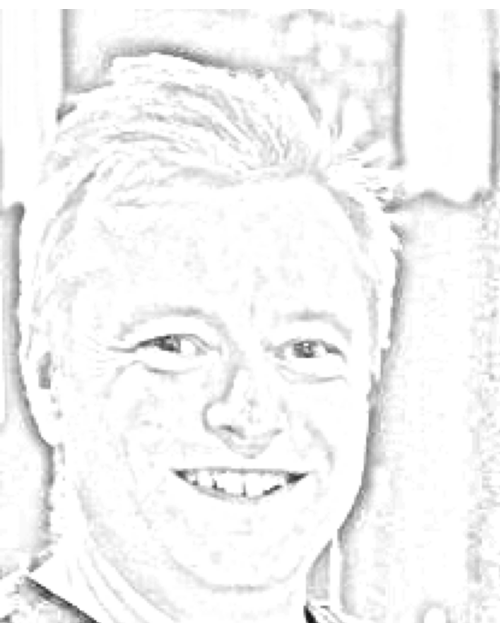
The following code listing contains the same as above and also includes the code to convert to a cartoon style.
import os
import glob
import cv2
import matplotlib.pyplot as plt
import numpy as np

def edge_mask(img, line_size, blur_value):
  gray = cv2.cvtColor(img, cv2.COLOR_BGR2GRAY)
  gray_blur = cv2.medianBlur(gray, blur_value)
  edges = cv2.adaptiveThreshold(gray_blur, 255, cv2.ADAPTIVE_THRESH_MEAN_C, cv2.THRESH_BINARY, line_size, blur_value)
  return edges

def cartoon_image(img_cartoon):
    img=img_cartoon

    line_size = 7
    blur_value = 7
    edges = edge_mask(img, line_size, blur_value)

    #Clustering - (K-MEANS)
    imgf=np.float32(img).reshape(-1,3)
    criteria=(cv2.TERM_CRITERIA_EPS+cv2.TERM_CRITERIA_MAX_ITER,20,1.0)
    compactness,label,center=cv2.kmeans(imgf,5,None,criteria,10,cv2.KMEANS_RANDOM_CENTERS)
    center=np.uint8(center)
    final_img=center[label.flatten()]
    final_img=final_img.reshape(img.shape)

    cartoon=cv2.bitwise_and(final_img,final_img,mask=edges)

    return cartoon

def sketch_image(image_file, blur):
    import_image = cv2.imread(image_file)

    #cvtColor function
    grey_image = cv2.cvtColor(import_image, cv2.COLOR_BGR2GRAY)
    #invert the image
    invert_image = cv2.bitwise_not(grey_image)

    blur_image=cv2.GaussianBlur(invert_image, (blur,blur),0)   #111,111

    #Invert Blurred Image
    #Repeat previous step
    invblur_image=cv2.bitwise_not(blur_image)

    sketch_image=cv2.divide(grey_image, invblur_image, scale=256.0)
    cartoon_img=cartoon_image(import_image)

    #plot images
#    plt.figure(figsize=(9,6))
    plt.rcParams["figure.figsize"] = (12,8)

    #plot cartoon
    plt.subplot(1,3,3)
    plt.imshow(cv2.cvtColor(cartoon_img, cv2.COLOR_BGR2RGB))
    plt.title('Cartoon Image', size=12, color='red')
    plt.axis(False)

    #plot sketch
    plt.subplot(1,3,2)
    plt.imshow(cv2.cvtColor(sketch_image, cv2.COLOR_BGR2RGB))
    plt.title('Sketch Image', size=12, color='red')
    plt.axis(False)
    #plot original image
    plt.subplot(1,3,1)
    plt.imshow(cv2.cvtColor(import_image, cv2.COLOR_BGR2RGB))
    plt.title('Original Image', size=12, color='blue')
    plt.axis(False)

    #plot show
    plt.show()

for filepath in glob.iglob(dir+'SYM42-Board*.*'):
    #print(filepath)
    #import_image = cv2.imread(dir+file)
    sketch_image(filepath, 23)
For the SYM42 Board members, we get the following output.

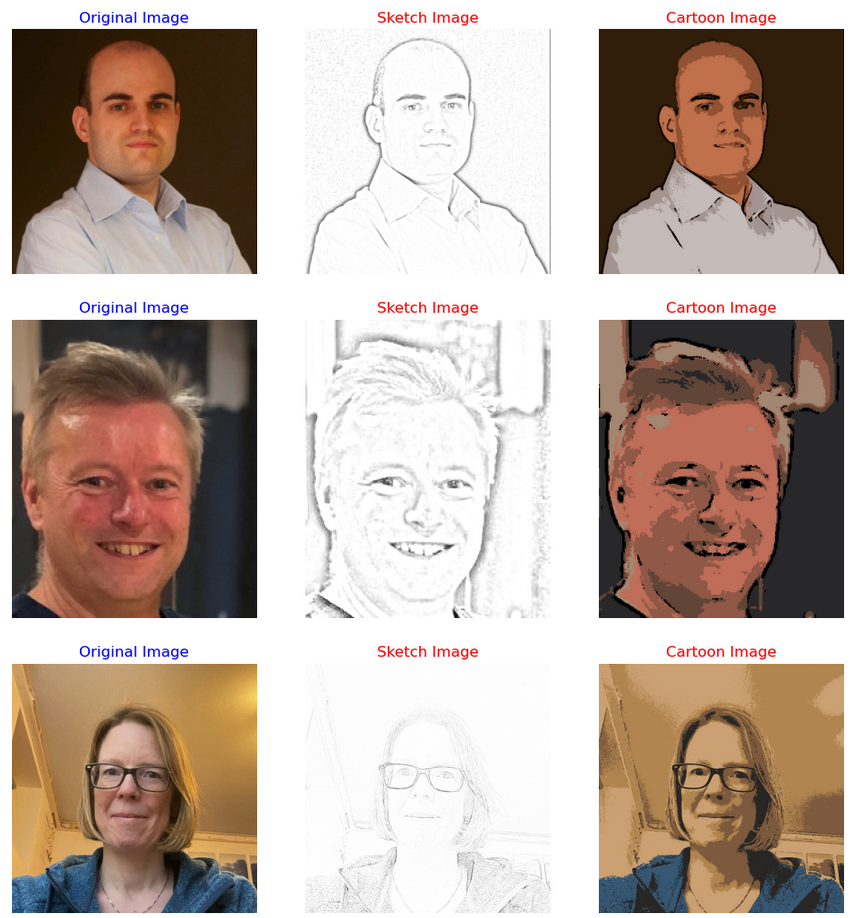
As you can see from these images, some are converted in a way you would expect. While others seem to give little effect.
Thanks to the Board of SYM42 for allowing me to use their images.

You must be logged in to post a comment.