
Data
Creating Test Data in your Database using Faker
A some point everyone needs some test data for their database. There area a number of ways of doing this, and in this post I’ll walk through using the Python library Faker to create some dummy test data (that kind of looks real) in my Oracle Database. I’ll have another post using the GenAI in-database feature available in the Oracle Autonomous Database. So keep an eye out for that.
Faker is one of the available libraries in Python for creating dummy/test data that kind of looks realistic. There are several more. I’m not going to get into the relative advantages and disadvantages of each, so I’ll leave that task to yourself. I’m just going to give you a quick demonstration of what is possible.
One of the key elements of using Faker is that we can set a geograpic location for the data to be generated. We can also set multiples of these and by setting this we can get data generated specific for that/those particular geographic locations. This is useful for when testing applications for different potential markets. In my example below I’m setting my local for USA (en_US).
Here’s the Python code to generate the Test Data with 15,000 records, which I also save to a CSV file.
import pandas as pd
from faker import Faker
import random
from datetime import date, timedelta

#####################
NUM_RECORDS = 15000
LOCALE = 'en_US'

#Initialise Faker
Faker.seed(42)
fake = Faker(LOCALE)

#####################

#Create a function to generate the data
def create_customer_record():
    #Customer Gender
    gender = random.choice(['Male', 'Female', 'Non-Binary'])
    #Customer Name
    if gender == 'Male':
        name = fake.name_male()
    elif gender == 'Female':
        name = fake.name_female()
    else:
        name = fake.name()

    #Date of Birth
    dob = fake.date_of_birth(minimum_age=18, maximum_age=90)

    #Customer Address and other details
    address = fake.street_address()
    email = fake.email()
    city = fake.city()
    state = fake.state_abbr()
    zip_code = fake.postcode()
    full_address = f"{address}, {city}, {state} {zip_code}"
    phone_number = fake.phone_number()

    #Customer Income
    #  - annual income between $30,000 and $250,000
    income = random.randint(300, 2500) * 100

    #Credit Rating
    credit_rating = random.choices(['A', 'B', 'C', 'D'], weights=[0.40, 0.30, 0.20, 0.10], k=1)[0]

    #Credit Card and Banking details
    card_type = random.choice(['visa', 'mastercard', 'amex'])
    credit_card_number = fake.credit_card_number(card_type=card_type)
    routing_number = fake.aba()
    bank_account = fake.bban()

    return {
        'CUSTOMERID': fake.unique.uuid4(), # Unique identifier
        'CUSTOMERNAME': name,
        'GENDER': gender,
        'EMAIL': email,
        'DATEOFBIRTH': dob.strftime('%Y-%m-%d'),
        'ANNUALINCOME': income,
        'CREDITRATING': credit_rating,
        'CUSTOMERADDRESS': full_address,
        'ZIPCODE': zip_code,
        'PHONENUMBER': phone_number,
        'CREDITCARDTYPE': card_type.capitalize(),
        'CREDITCARDNUMBER': credit_card_number,
        'BANKACCOUNTNUMBER': bank_account,
        'ROUTINGNUMBER': routing_number,
    }

#Generate the Demo Data
print(f"Generating {NUM_RECORDS} customer records...")
data = [create_customer_record() for _ in range(NUM_RECORDS)]
print("Sample Data Generation complete")

#Convert to Pandas DataFrame
df = pd.DataFrame(data)

print("\n--- DataFrame Sample (First 10 Rows) : sample of columns ---")
# Display relevant columns for verification
display_cols = ['CUSTOMERNAME', 'GENDER', 'DATEOFBIRTH', 'PHONENUMBER', 'CREDITCARDNUMBER', 'CREDITRATING', 'ZIPCODE']
print(df[display_cols].head(10).to_markdown(index=False))

print("\n--- DataFrame Information ---")
print(f"Total Rows: {len(df)}")
print(f"Total Columns: {len(df.columns)}")
print("Data Types:")
print(df.dtypes)
The output from the above code gives the following:
Generating 15000 customer records...
Sample Data Generation complete

--- DataFrame Sample (First 10 Rows) : sample of columns ---
| CUSTOMERNAME     | GENDER     | DATEOFBIRTH   | PHONENUMBER            |   CREDITCARDNUMBER | CREDITRATING   |   ZIPCODE |
|:-----------------|:-----------|:--------------|:-----------------------|-------------------:|:---------------|----------:|
| Allison Hill     | Non-Binary | 1951-03-02    | 479.540.2654           |   2271161559407810 | A              |     55488 |
| Mark Ferguson    | Non-Binary | 1952-09-28    | 724.523.8849x696       |    348710122691665 | A              |     84760 |
| Kimberly Osborne | Female     | 1973-08-02    | 001-822-778-2489x63834 |   4871331509839301 | B              |     70323 |
| Amy Valdez       | Female     | 1982-01-16    | +1-880-213-2677x3602   |   4474687234309808 | B              |     07131 |
| Eugene Green     | Male       | 1983-10-05    | (442)678-4980x841      |   4182449353487409 | A              |     32519 |
| Timothy Stanton  | Non-Binary | 1937-10-13    | (707)633-7543x3036     |    344586850142947 | A              |     14669 |
| Eric Parker      | Male       | 1964-09-06    | 577-673-8721x48951     |   2243200379176935 | C              |     86314 |
| Lisa Ball        | Non-Binary | 1971-09-20    | 516.865.8760           |    379096705466887 | A              |     93092 |
| Garrett Gibson   | Male       | 1959-07-05    | 001-437-645-2991       |    349049663193149 | A              |     15494 |
| John Petersen    | Male       | 1978-02-14    | 367.683.7770           |   2246349578856859 | A              |     11722 |

--- DataFrame Information ---
Total Rows: 15000
Total Columns: 14
Data Types:
CUSTOMERID           object
CUSTOMERNAME         object
GENDER               object
EMAIL                object
DATEOFBIRTH          object
ANNUALINCOME          int64
CREDITRATING         object
CUSTOMERADDRESS      object
ZIPCODE              object
PHONENUMBER          object
CREDITCARDTYPE       object
CREDITCARDNUMBER     object
BANKACCOUNTNUMBER    object
ROUTINGNUMBER        object
Having generated the Test data, we now need to get it into the database. There a various ways of doing this. As we are already using Python I’ll illustrate getting the data into the Database below. An alternative option is to use SQL Command Line (SQLcl) and the LOAD feature in that tool.
Here’s the Python code to load the data. I’m using the oracledb python library.
### Connect to Database
import oracledb

p_username = "..."
p_password = "..."

#Give OCI Wallet location and details
try:
    con = oracledb.connect(user=p_username, password=p_password, dsn="adb26ai_high",
                       config_dir="/Users/brendan.tierney/Dropbox/Wallet_ADB26ai",
                       wallet_location="/Users/brendan.tierney/Dropbox/Wallet_ADB26ai",
                       wallet_password=p_walletpass)
except Exception as e:
    print('Error connecting to the Database')
    print(f'Error:{e}')

print(con)
### Create Customer Table
drop_table = 'DROP TABLE IF EXISTS demo_customer'
cre_table = '''CREATE TABLE DEMO_CUSTOMER (
CustomerID VARCHAR2(50) PRIMARY KEY,
CustomerName VARCHAR2(50),
Gender VARCHAR2(10),
Email VARCHAR2(50),
DateOfBirth DATE,
AnnualIncome NUMBER(10,2),
CreditRating VARCHAR2(1),
CustomerAddress VARCHAR2(100),
ZipCode VARCHAR2(10),
PhoneNumber VARCHAR2(50),
CreditCardType VARCHAR2(10),
CreditCardNumber VARCHAR2(30),
BankAccountNumber VARCHAR2(30),
RoutingNumber VARCHAR2(10) )'''
cur = con.cursor()
print('--- Dropping DEMO_CUSTOMER table ---')
cur.execute(drop_table)
print('--- Creating DEMO_CUSTOMER table ---')
cur.execute(cre_table)
print('--- Table Created ---')### Insert Data into Table
insert_data = '''INSERT INTO DEMO_CUSTOMER values (:1, :2, :3, :4, :5, :6, :7, :8, :9, :10, :11, :12, :13, :14)'''
print("--- Inserting records ---")
cur.executemany(insert_data, df )
con.commit()
print("--- Saving to CSV ---")
df.to_csv('/Users/brendan.tierney/Dropbox/DEMO_Customer_data.csv', index=False)
print("- Finished -")### Close Connections to DB
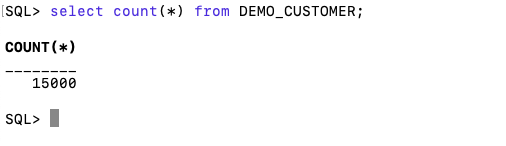
con.close()and to prove the records got inserted we can connect to the schema using SQLcl and check.
Biases in Data
We work with data in a variety of different ways throughout our organisation. Some people are consumers of data and in particular data that is the output of various data analytics, machine learning or artificial intelligence applications. Being a consumer of data from these applications we (easily) made the assumption that the data used is correct and the results being presented to us (in various forms) is correct.
But all too often we hear about some adjustments being made to the data or the processing to correct “something” that was discovered. One the these “something” can be classified as a Data Bias. This kind of problem has been increasing in importance over the past couple of years. Some of this importance has been led by the people involved in creating and process this data discovering certain issues or “something” in the data. Some has been identified by the consumer when the discover “something” odd or unusual about the data. This list could get very long, but another aspect is with the introduction of EU GDPR, there is now a legal aspect to ensuring no data biases exist. Part of the problem with EU GDPR, in this aspect, is it is very vague on what is required. This in turn has caused some confusion on what is required of organisations and their staff. But with the arrival of the EU AI Regulations there is a renewed focus on identifying and addressing Data Bias. With the EU AI Regulations there is a requirement that Data Bias is addressed at each step when data is collected, processed and generated.
The following list outlines some of the typical Data Bias scenarios you or you organisation may encounter.
- Definition bias: Occurs when someone words or phrases a problem or description of data based on their own requirements, rather than based on the organisational or domain definitions. This can lead to misleading results or when commencing an analytics project can lead the project is a specific (biased) direction
- Sample bias: This occurs when the dataset created for input to the analytics or machine learning does not reflect the data from the original data sources. The sampling method used fails to attain true randomness before selection This can result in models having lower accuracy with certain sub-groups of the data (i.e. Customers) which might not have been included or under-represented in the sampled dataset. Sometimes this type of bias is referred to as selection bias.
- Measurement bias: This occurs when data collected for training differs from that collected in the original data sources. It can also occur when incorrect measurements or calculations are applied to the data. An example of this bias occurs with inconsistent annotation labeling and/or with re-coding of data to give incorrect or misleading meaning.
- Selection bias: This occurs when the dataset created for analytics is not large enough or representative enough to include all possible data combinations. This can occur due to human or algorithmic data processing biases. Sample bias plays a sub-role within Selection bias. This can happen at both record and attribute/feature selection levels. Selection bias is sometimes referred to as Exclusion bias, as certain data is excluded by the whoever is creating the dataset.
- Recall bias: This bias arises when labels (target feature) are inconsistently given based on subjective observations. This results in lower accuracy.
- Observer bias: This is the effect of seeing what you expect to see or want to see in data. The observers have subjective thoughts about their study, either conscious or unconscious. This leads to incorrectly labelled or recorded data. For example, two data scientist give different labels for an event. Their labeling is based on the subjective thoughts rather than following provided guidelines or seeking verification for their decisions. Sometimes this type of bias is referred to as Confirmation bias.
- Racial & Gender bias & Similar: Racial bias occurs when data skews in favor of particular demographics. Similar scenarios can occur for gender and other similar types of data. For example, facial recognition fails to recognize people of color as these have been under represented in the training datasets.
- Minority bias: This is similar to the previous Racial and Gender bias. This occurs when a minority group(s) are excluded from the dataset.
- Association bias: This occurs when the data reinforces or multiplies a cultural bias. Your dataset may have a collection of jobs in which all men have job X and all women have job Y. A machine learning model built using this data will preclude women from job X and men from job Y. Association bias is known for creating gender bias.
- Algorithmic bias: Occurs when the algorithm is selective on what data it uses to create a model for the data and problem. Extra validation checks and testing is needed to ensure no additional biases have been created and no biases (based on the previous types above) have been amplified by the algorithm.
- Reporting bias: Occurs when only a selection of results or outcomes are present. The person preparing the data is selective on what information they share with others. This typically leads to under reporting of certain, and somethings important, information.
- Confirmation bias: Occurs when the data/results are interpreted favoring information that confirms previously existing beliefs.
- Response / Non-Response bias: Occurs when results from surveys can be considered misleading based on the questions asked and subset of population who responded to the survey. If 95% of respondents said they link surveys, then is misleading. The quality and accuracy of the data will be poor in such situations

You must be logged in to post a comment.