
Oracle Analytics Cloud
2024 Leaving Certificate Results – Inline
The 2024 Leaving Certificate results are out. Up, down and across the country there have been tears of joy and some muted celebrations. But there have been some disappointments too. Although the government has been talking about how the marks have been increased, with post mark adjustments, this doesn’t help students come to terms with their results.
In previous years, I’ve looked at the profile of marks across some (not all) of the Leaving Certificate tools (the tools I used included an Oracle Database, and used Oracle Analytics Cloud to do some of the analysis along with other tools). Check out these previous posts
- Leaving Certificate 2023 – Inline or more adjustments
- CAO Points 2023
- Leaving Certificate 2022 – Inflation, deflation or in-line
- CAO Points 2022
From analysing the results for 2024, both numerically and graphically, we can see the results this year are broadly inline with last year. That news might bring some joy to some students but will be slightly disappointing for others. You can see this for yourself from the graphics below. However, in some subjects, there appears to be some minor (yes very minor) changes in the profiles, with a slight shift to the left, indicating a slight decrease in the higher grades and a corresponding increase in lower grades. But across many subjects, we have seen a slight increase in those achieving a H1 grade. The impact of these slight changes will be seen in the CAO points needed for the courses in the 550+ courses. But for the courses below 500 points, we might not see much of a change in CAO points. Although there might be some minor fluctuations based on demand for certain courses, which is typical most years.
I’ll have another post looking at the CAO points after they are released, so look out for that post.
The charts below give the profile of marks for each year between 2019 (pre-Covid) and 2024. The chart on the left includes all years, and the chart on the right is for the last four years. This allows us to see if there have been any adjustments in the profiles over those years. For most subjects, we can see a marked reduction of marks for certain subjects since the 2021 exceptionally high marks. While some subjects are almost back to matching the 2019 profile (science subjects, Irish), for others the stepback needed is small. Based on the messaging from the government, the stepping back will commence in 2025
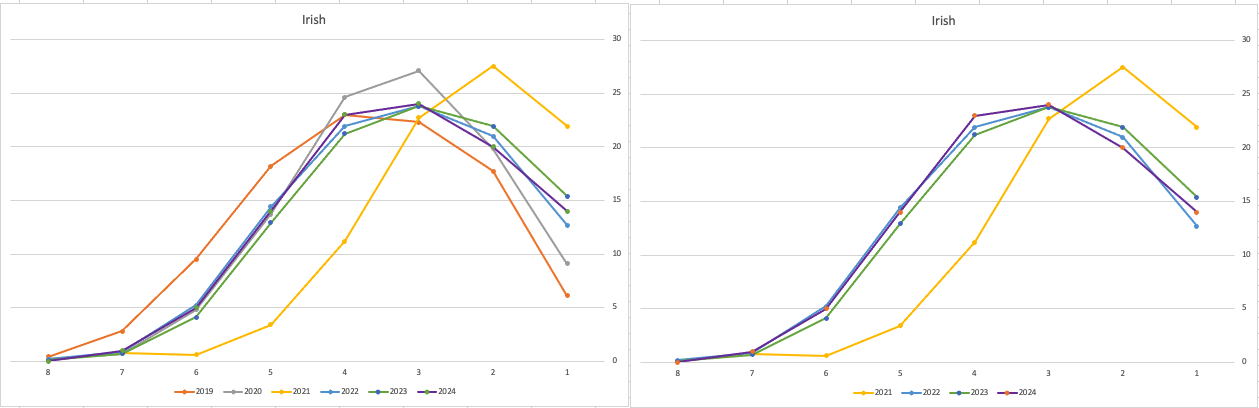
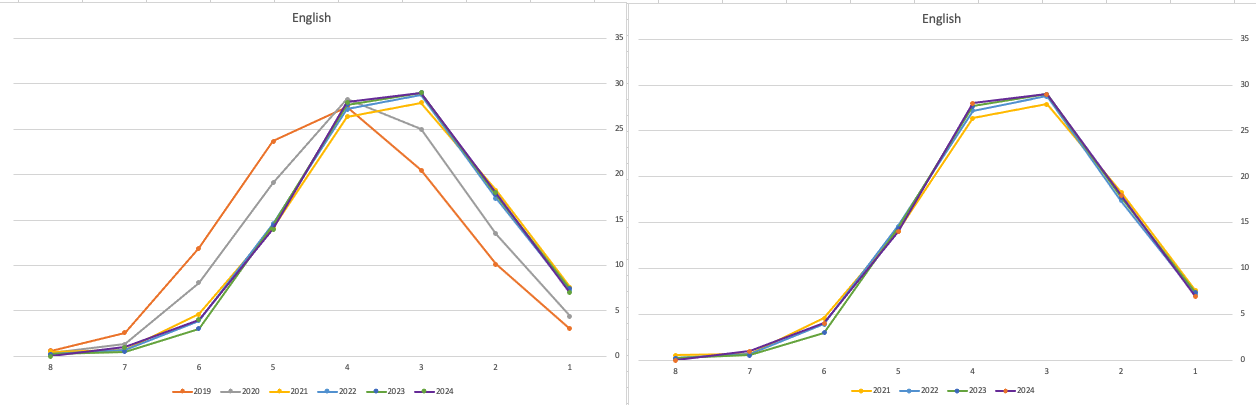
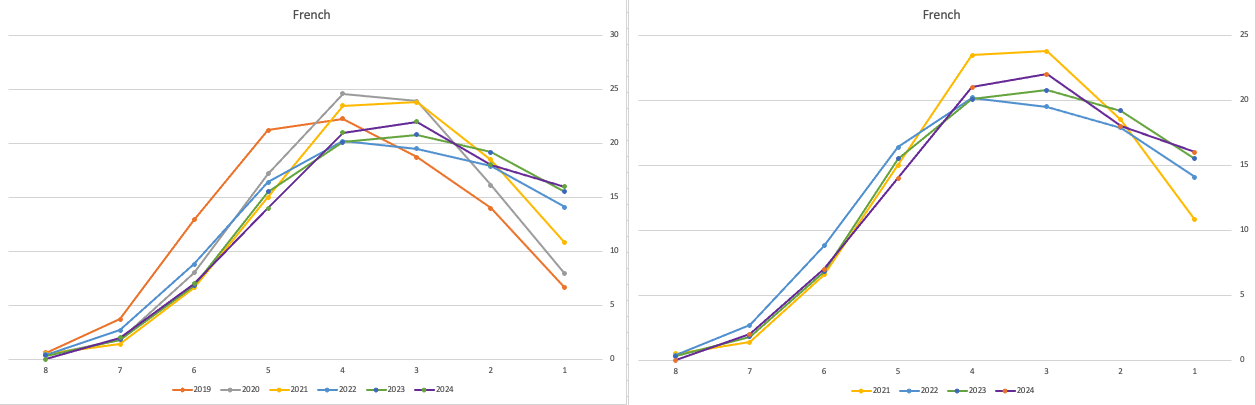
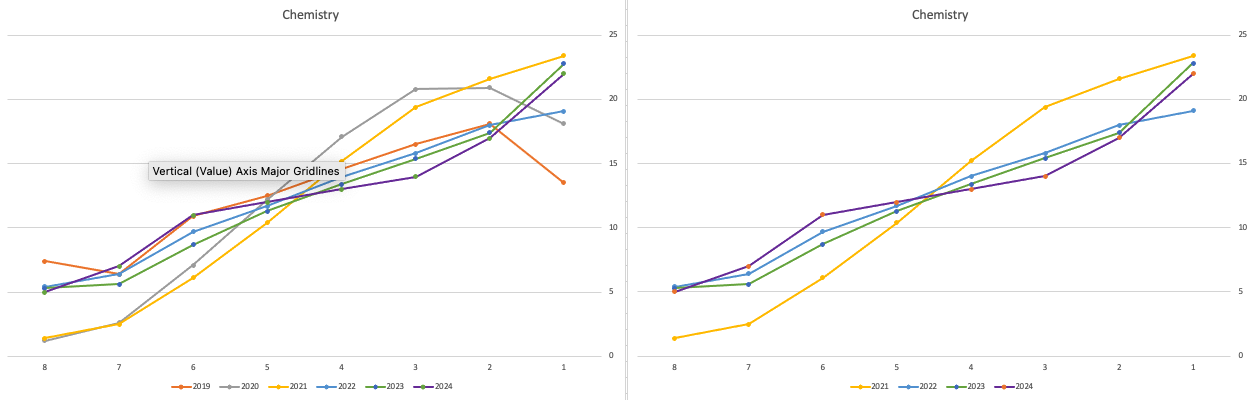
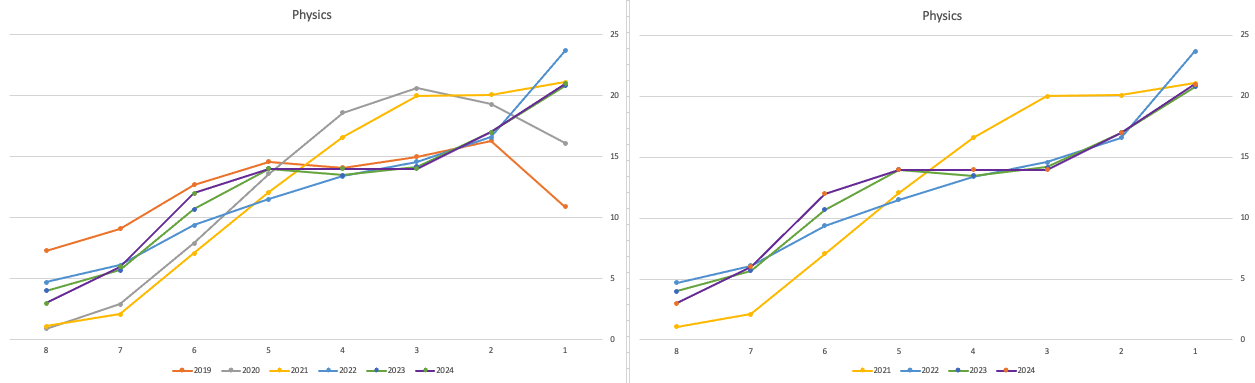
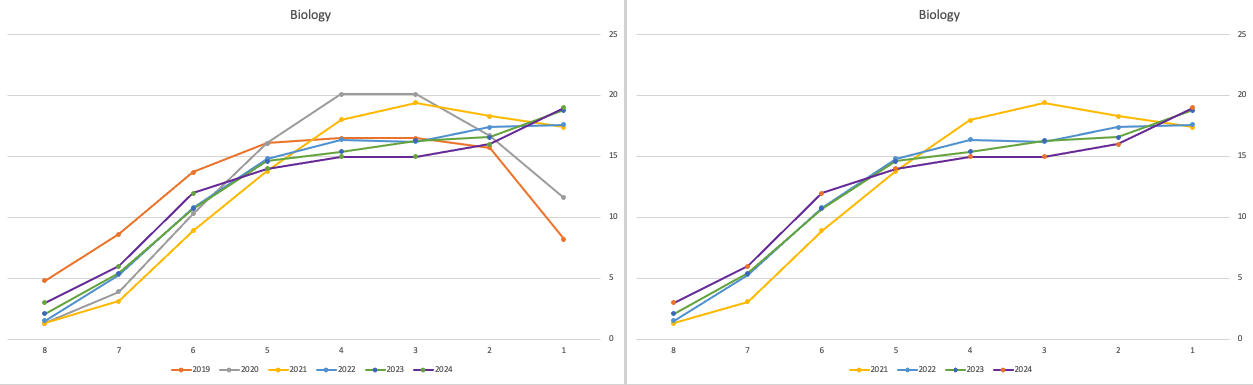
Back in April, an Irish Times article discussed the changes coming from 2025, where there will be a gradual return to “normal” (pre-Covid) profile of marks. Looking at the profile of marks over the past couple of years we can clearly see there has been some stepping back in the profile of marks. Some subjects are back to pre-Covid 2019 profiles. In some subjects, this is more evident than in others. They’ve used the phrase “on aggregate” to hide the stepping back in some subjects and less so in others.
Applying a Machine Learning Model in OAC
There are a number of different tools and languages available for machine learning projects. One such tool is Oracle Analytics Cloud (OAC). Check out my article for Oracle Magazine that takes you through the steps of using OAC to create a Machine Learning workflow/dataflow.

Oracle Analytics Cloud provides a single unified solution for analyzing data and delivering analytics solutions to businesses. Additionally, it provides functionality for processing data, allowing for data transformations, data cleaning, and data integration. Oracle Analytics Cloud also enables you to build a machine learning workflow, from loading, cleaning, and transforming data and creating a machine learning model to evaluating the model and applying it to new data—without the need to write a line of code. My Oracle Magazine article takes you through the various tasks for using Oracle Analytics Cloud to build a machine learning workflow.
That article covers the various steps with creating a machine learning model. This post will bring you through the steps of using that model to score/label new data.
In the Data Flows screen (accessed via Data->Data Flows) click on Create. We are going to create a new Data Flow to process the scoring/labeling of new data.

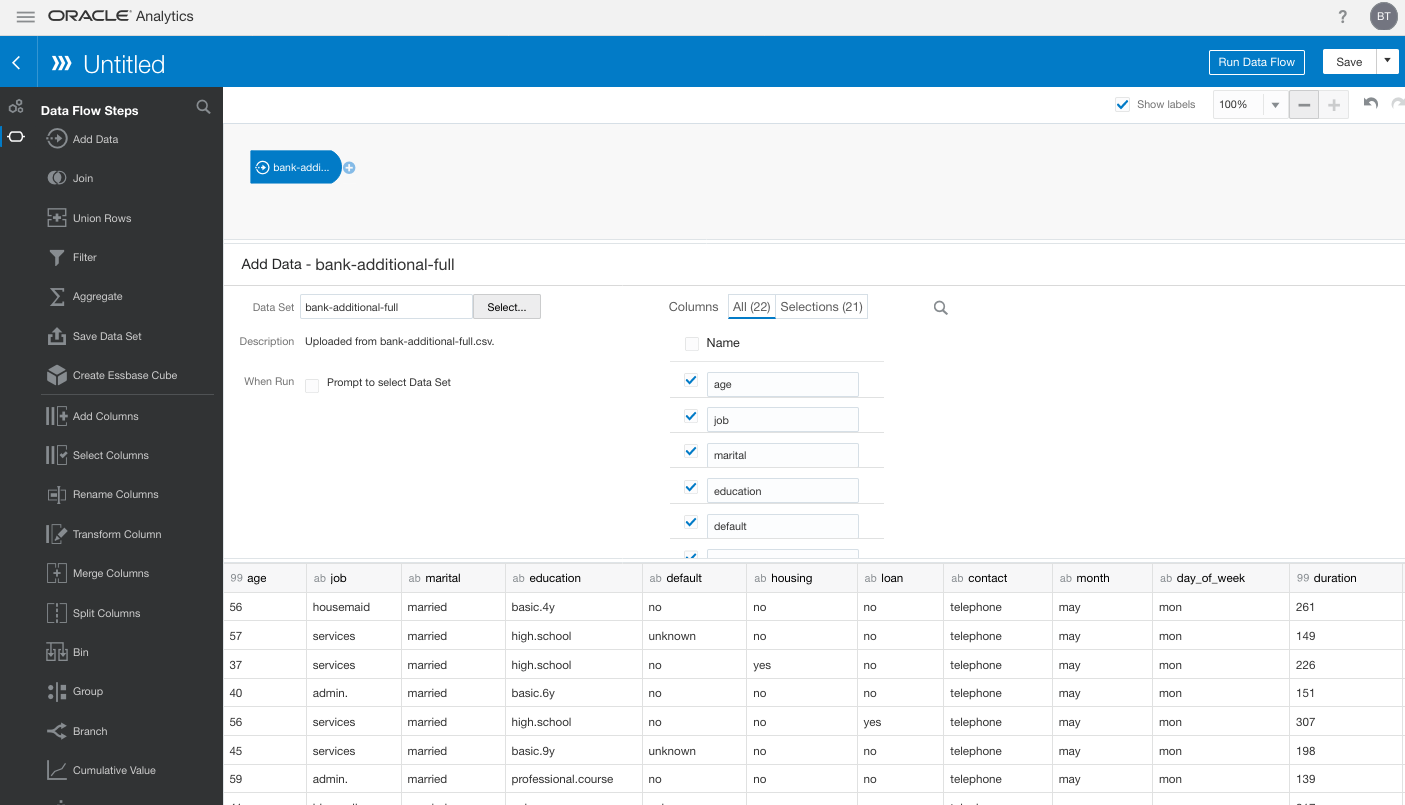
Select Data Flow from the pop-up menu. The ‘Add Data Set’ window will open listing your available data sets. In my example, I’m going to use the same data set that I used in the Oracle Magazine article to build the model. Click on the data set and then click on the Add button.

The initial Data Flow will be created with the node for the Data Set. The screen will display all the attributes for the data set and from this you can select what attributes to include or remove. For example, if you want a subset of the attributes to be used as input to the machine learning model, you can select these attributes at this stage. These can be adjusted at a later stages, but the data flow will need to be re-run to pick up these changes.
Next step is to create the Apply Model node. To add this to the data flow click on the small plus symbol to the right of the Data Node. This will pop open a window from which you will need to select the Apply Model.
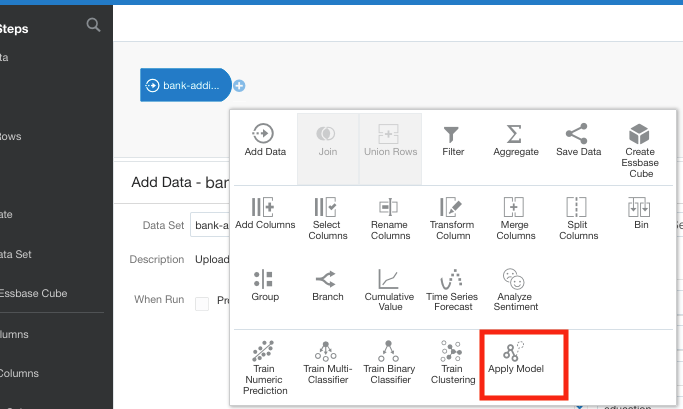
A pop-up window will appear listing the various machine learning models that exist in your OAC environment. Select the model you want to use and click the Ok button.

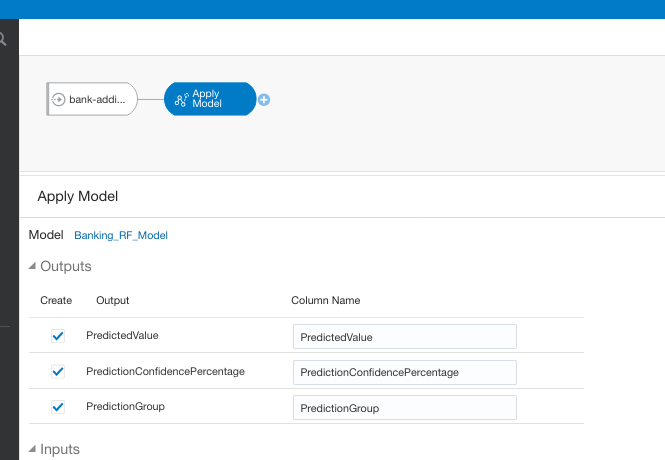
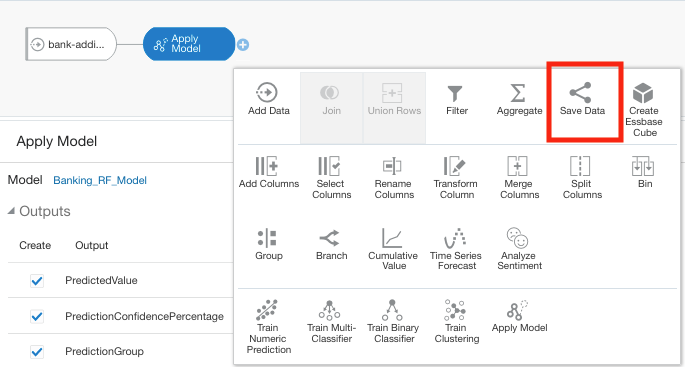
The next node to add to the data flow is to save the results/outputs from the Apply Model node. Click on the small plus icon to the right of the Apply Model node and select Save Results from the popup window.
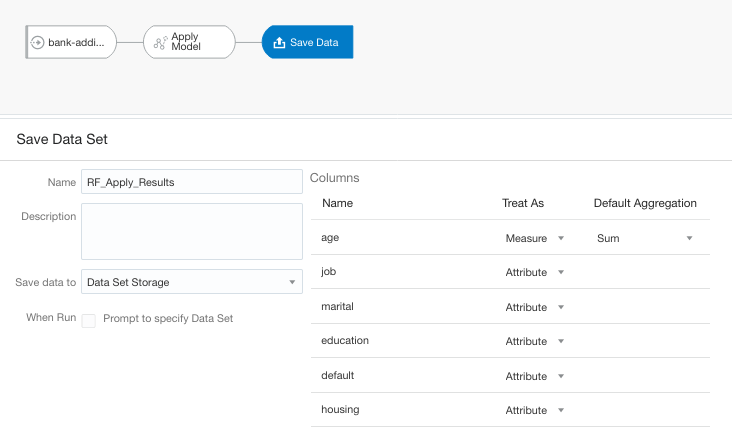
We now have a completed data flow. But before you finish edit the Save Data node to give a name for the Save Data Set, and you can edit what attributes/features you want in the result set.
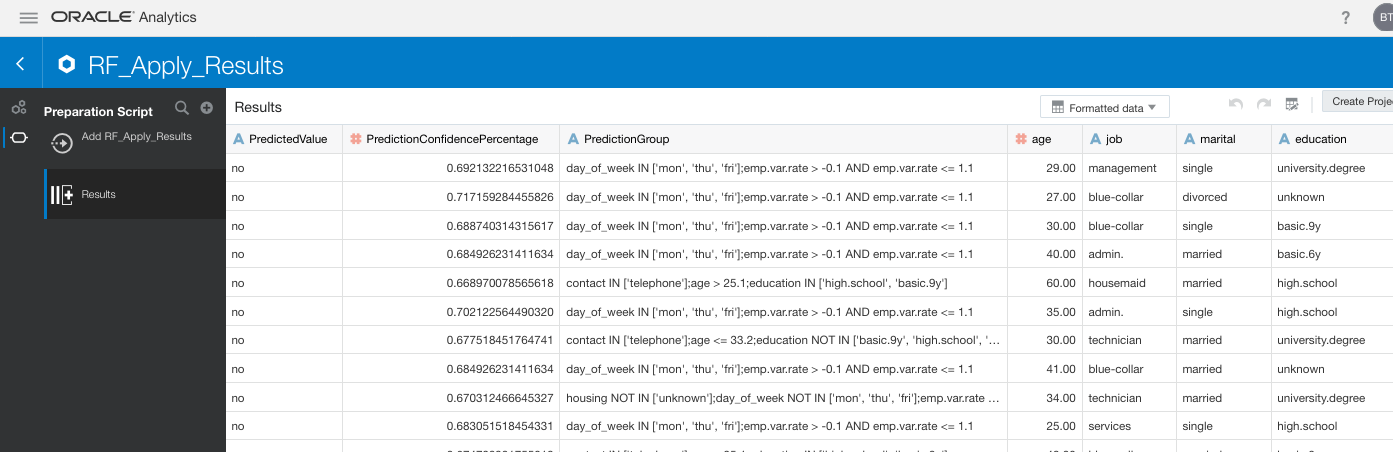
You can now save and run the Data Flow, and view the outputs from applying the machine learning model. The saved data set results can be viewed in the Data menu.

You must be logged in to post a comment.