
CAO Points 2022 – Grade inflation, deflation or in-line
Last week I wrote a blog post analysing the Leaving Cert results over the past 3-8 years. Part of that post also looked at the claim from the Dept of Education saying the results in 2022 would be “in-line on aggregate” with the results from 2021. The outcome of the analysis was grade deflation was very evident in many subjects, but when analysed and profiled at a very high level, they did look similar.
I didn’t go into how that might impact on the CAO (Central Applications Office) Points. If there was deflation in some of the core and most popular subjects, then you might conclude there could be some changes in the profile of CAO Points being awarded, and that in turn would have a small change on the CAO Points needed for a lot of University courses. But not all of them, as we saw last week, the increased number of students who get grades in the H4-H7 range. This could mean a small decrease in points for courses in the 520+ range, and a small increase in points needed in the 300-500-ish range.
The CAO have published the number of students of each 10 point range. I’ve compared the 2022 data, with each year going back to 2015. The following table is a high level summary of the results in 50 point ranges.
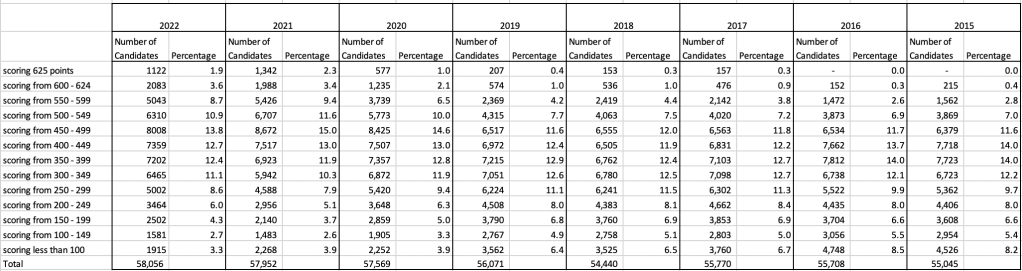
An initial look at these numbers and percentages might look like points are similar to last year and even 2020. But for 2015-2019 the similarity is closer. Again looking back at the previous blog post, we can see the results profiles for 20215-2019 are broadly similar and does indicate some normalisation might have been happening each year. The following chart illustrate the percentage of students who achieved points in each range.
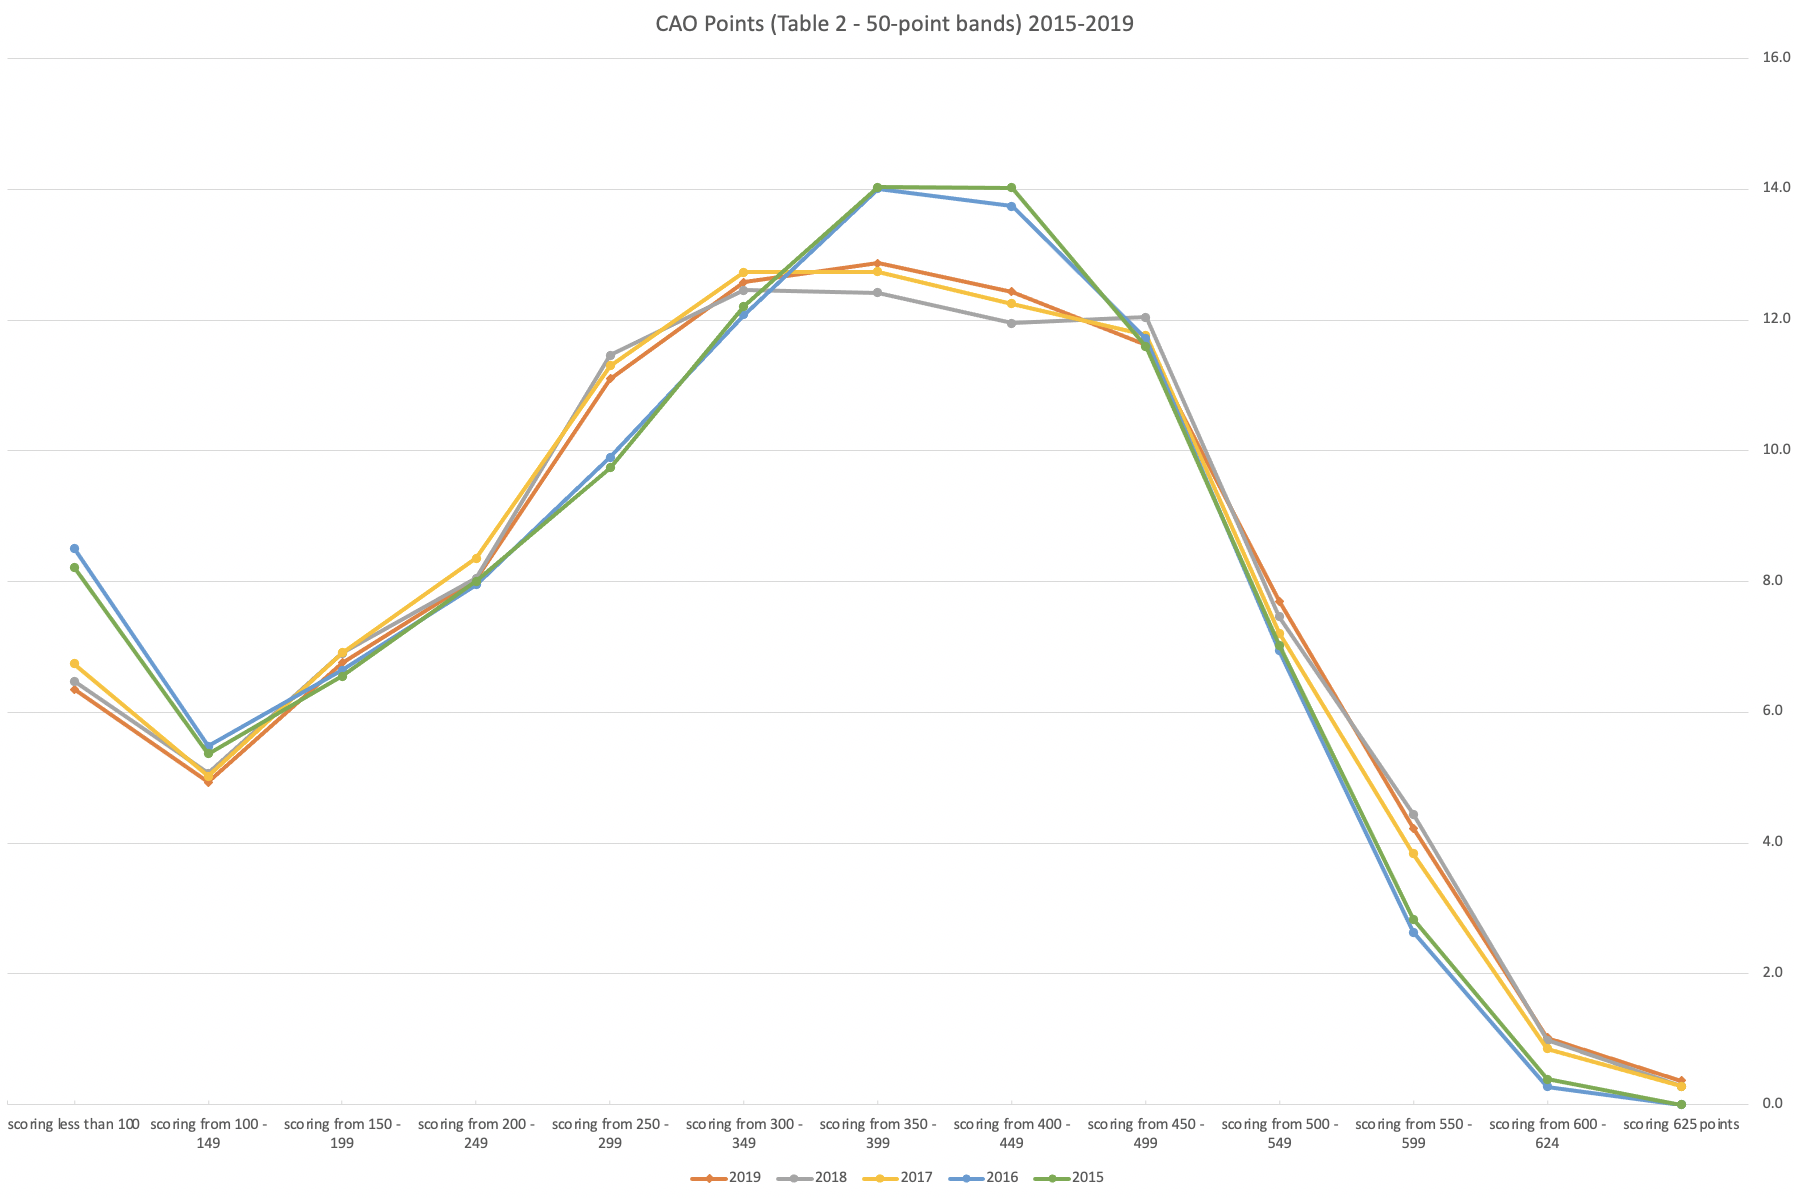
From the above we can see the profile is similar across 2015-2019, although there does seem to be a flattening of the curve between 2015-2016!
Let’s now have a look at 2019 (the last pre-coivd year), 2021 and 2022. This will allow use to compare the “inflated” years to the last “normal” year.
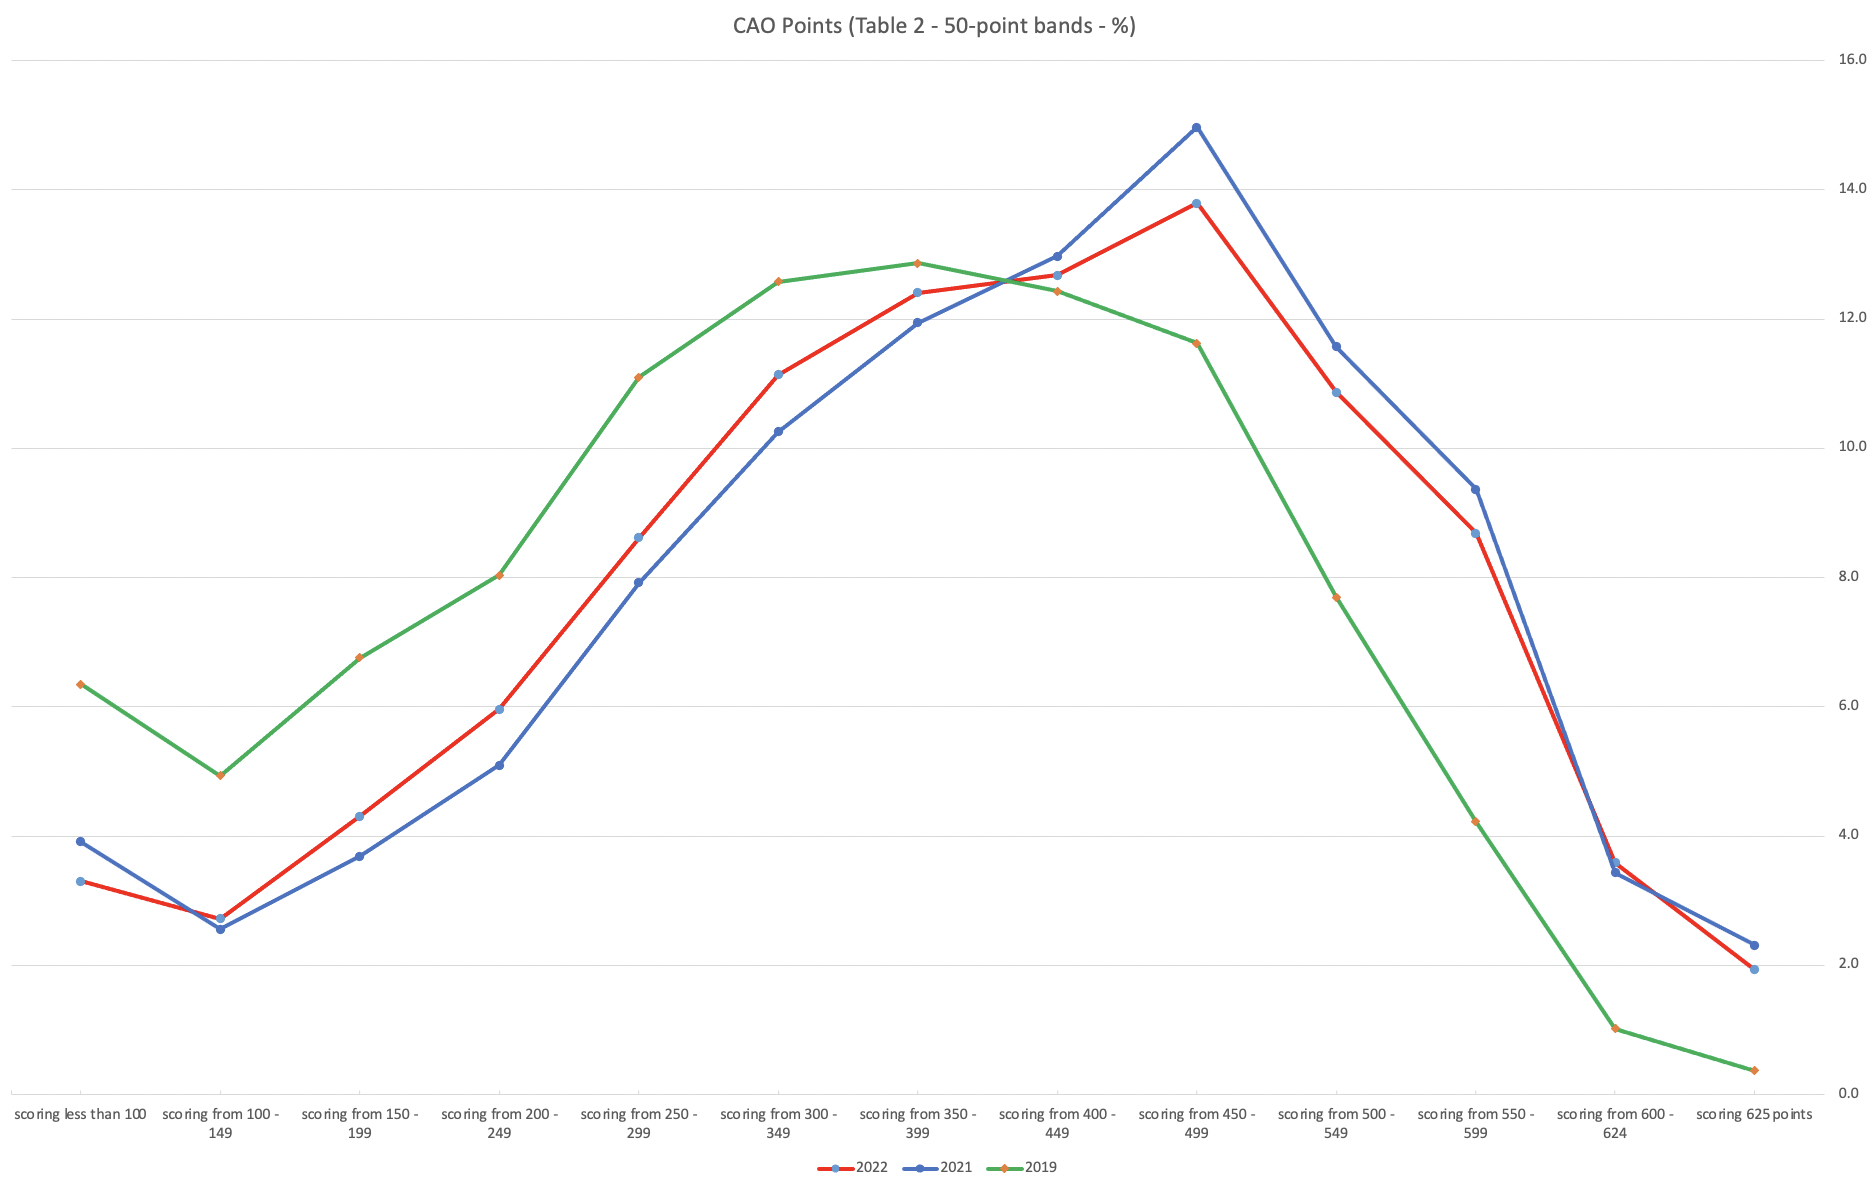
This chart clearly shows a shifting of the profile to the left for the red line which represents 2022. This also supports my blog post last week, and that the Dept of Education has started the process of deflating marks.
Based on this shifting/deflating of marks, we could see the grade/CAO Points profiles reverting back to almost 2019 profile by 2025. For students sitting the Leaving Cert in 2023, there will be another shift to the left, and with another similar shift in 2024. In 2024, the students will be the last group to sit the Leaving Cert who were badly affected during the Covid years. Many of them lost large chunks on school and many didn’t sit the Junior Cert. I’d predict 2025 will see the first time the marks/points profiles will match pre-covid years.
For this analysis I’ve used a variety of tools including Excel, Python and Oracle Analytics.
The Dataset used can be found under Dataset menu, and listed as ‘CAO Points Profiles 2015-2022’. Also, check out the Leaving Certificate 2015-2022 dataset.
