
Leaving Cert
2024 Leaving Certificate Results – Inline
The 2024 Leaving Certificate results are out. Up, down and across the country there have been tears of joy and some muted celebrations. But there have been some disappointments too. Although the government has been talking about how the marks have been increased, with post mark adjustments, this doesn’t help students come to terms with their results.
In previous years, I’ve looked at the profile of marks across some (not all) of the Leaving Certificate tools (the tools I used included an Oracle Database, and used Oracle Analytics Cloud to do some of the analysis along with other tools). Check out these previous posts
- Leaving Certificate 2023 – Inline or more adjustments
- CAO Points 2023
- Leaving Certificate 2022 – Inflation, deflation or in-line
- CAO Points 2022
From analysing the results for 2024, both numerically and graphically, we can see the results this year are broadly inline with last year. That news might bring some joy to some students but will be slightly disappointing for others. You can see this for yourself from the graphics below. However, in some subjects, there appears to be some minor (yes very minor) changes in the profiles, with a slight shift to the left, indicating a slight decrease in the higher grades and a corresponding increase in lower grades. But across many subjects, we have seen a slight increase in those achieving a H1 grade. The impact of these slight changes will be seen in the CAO points needed for the courses in the 550+ courses. But for the courses below 500 points, we might not see much of a change in CAO points. Although there might be some minor fluctuations based on demand for certain courses, which is typical most years.
I’ll have another post looking at the CAO points after they are released, so look out for that post.
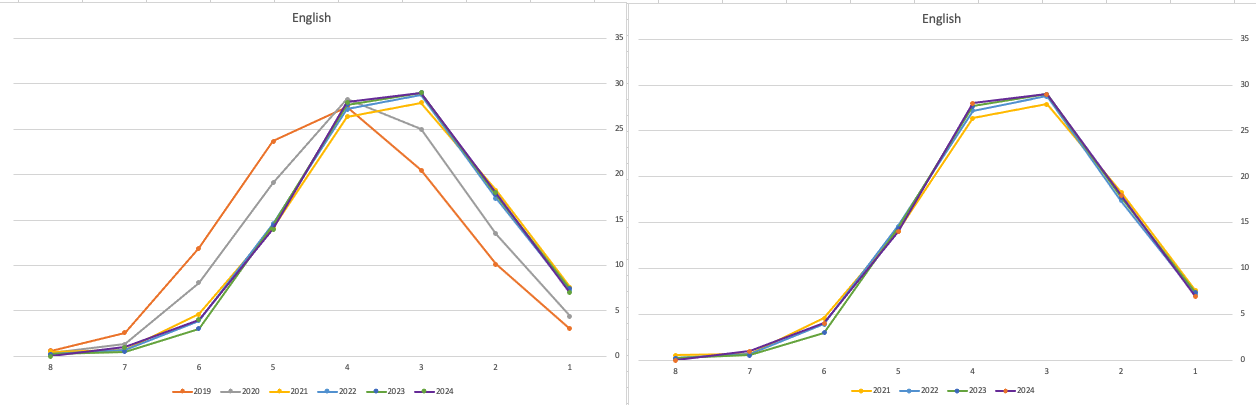
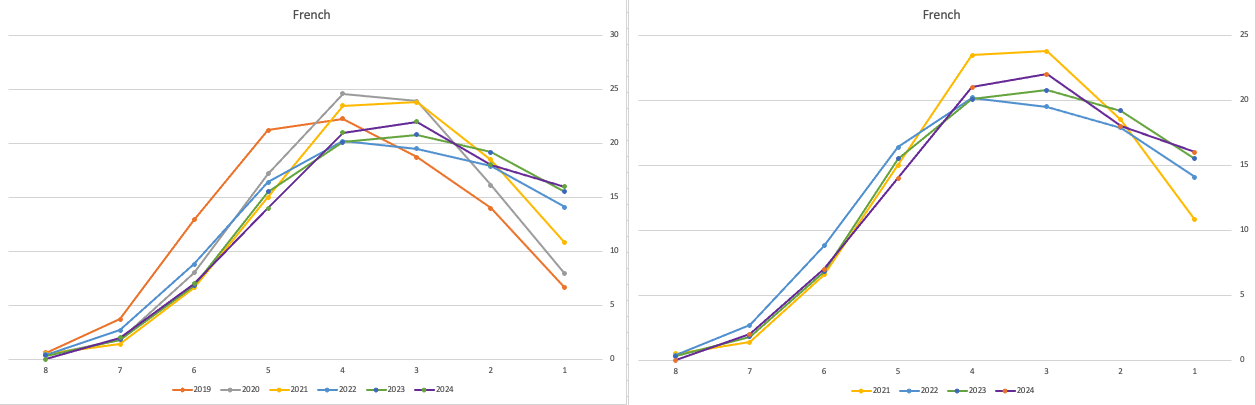
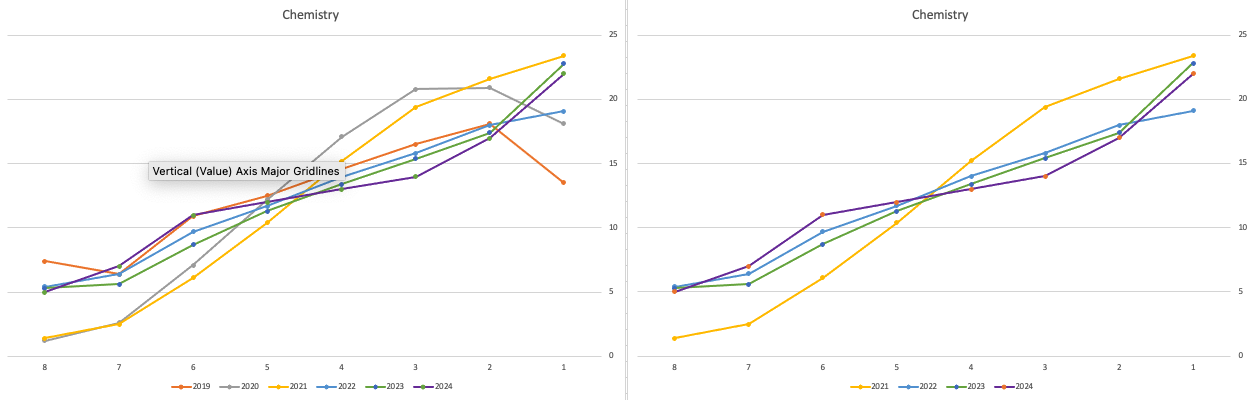
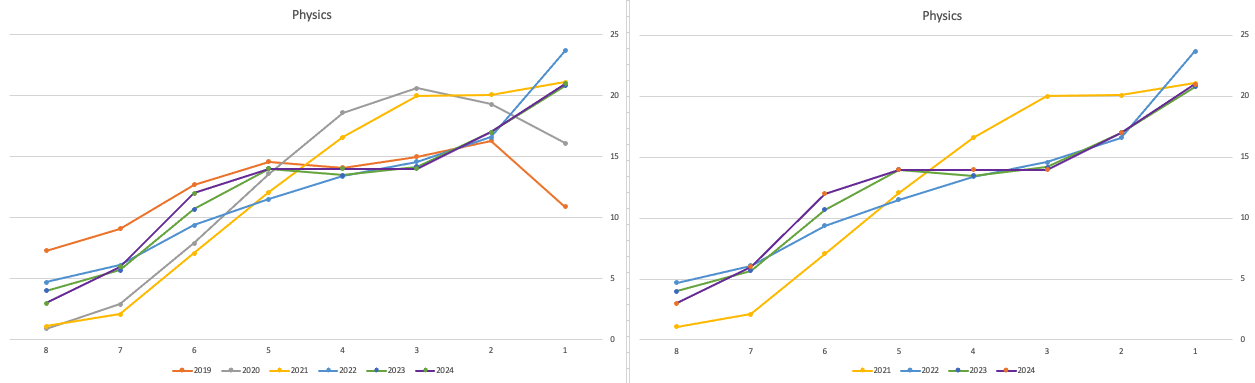
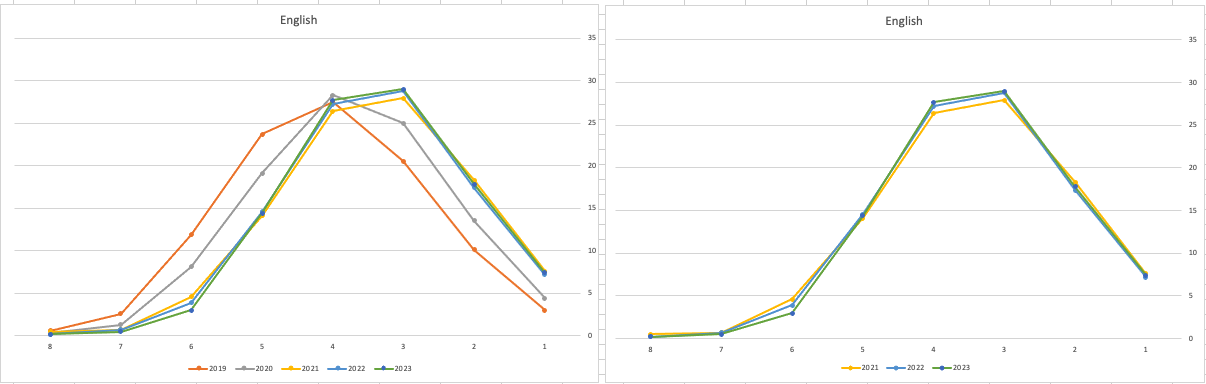
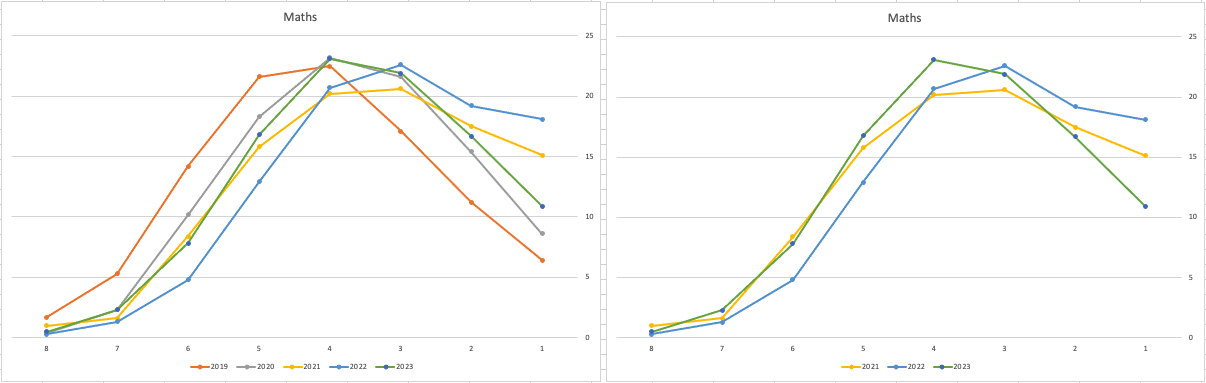
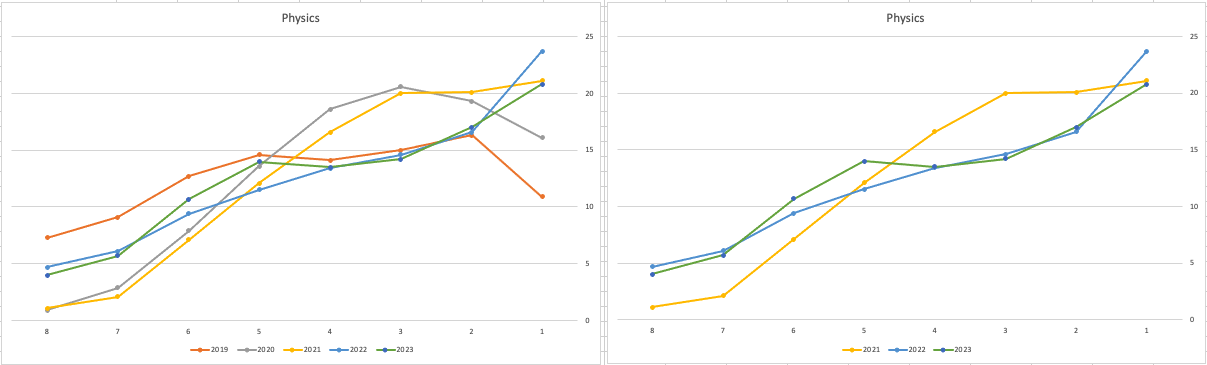
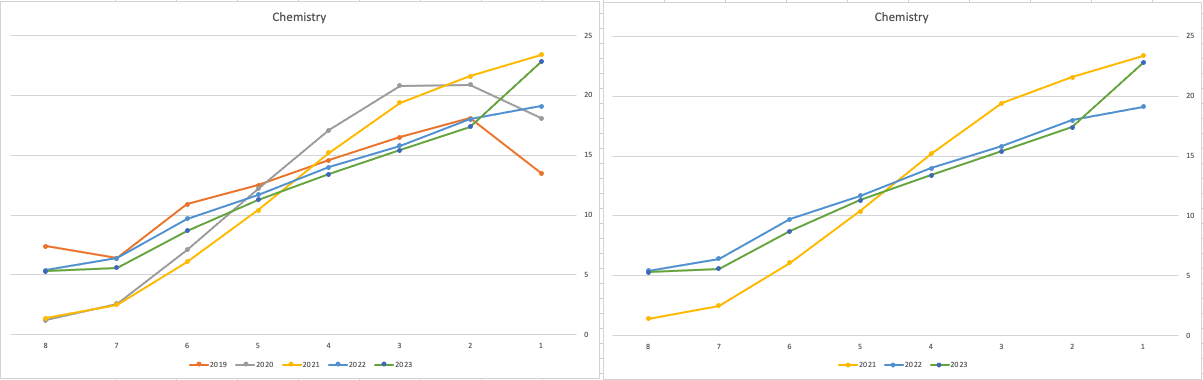
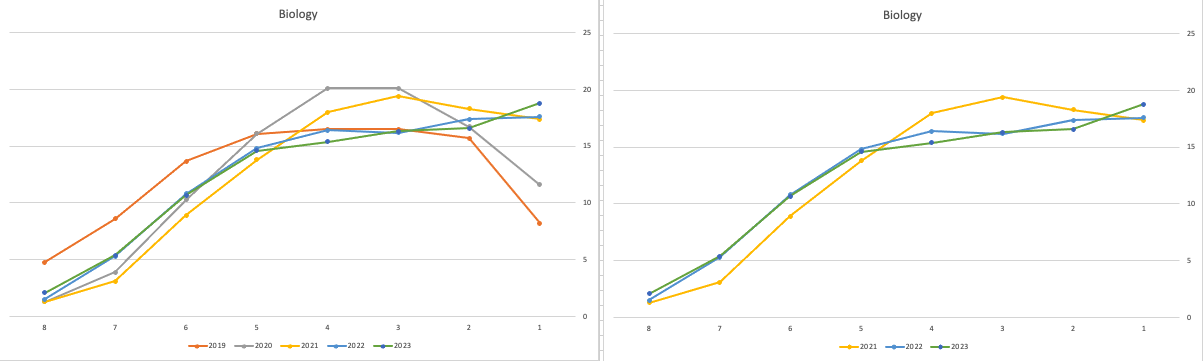
The charts below give the profile of marks for each year between 2019 (pre-Covid) and 2024. The chart on the left includes all years, and the chart on the right is for the last four years. This allows us to see if there have been any adjustments in the profiles over those years. For most subjects, we can see a marked reduction of marks for certain subjects since the 2021 exceptionally high marks. While some subjects are almost back to matching the 2019 profile (science subjects, Irish), for others the stepback needed is small. Based on the messaging from the government, the stepping back will commence in 2025
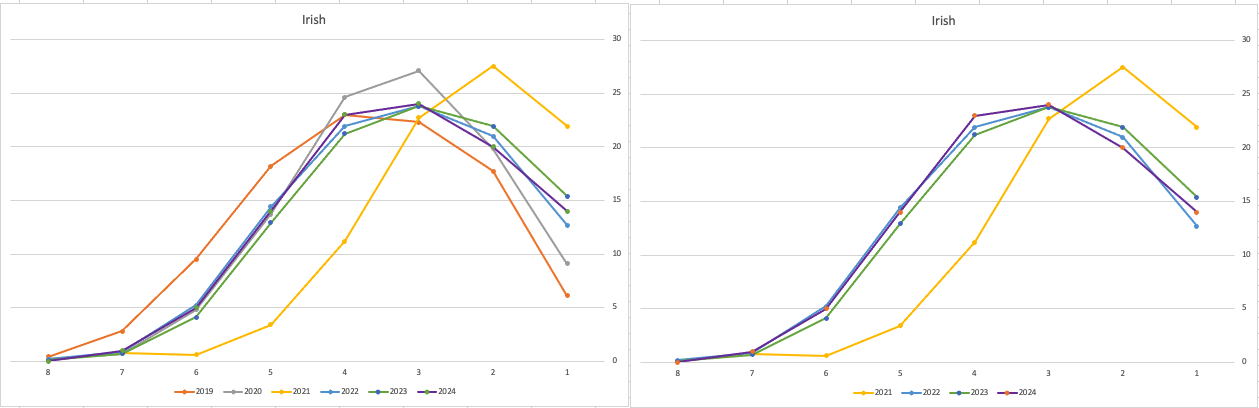
Back in April, an Irish Times article discussed the changes coming from 2025, where there will be a gradual return to “normal” (pre-Covid) profile of marks. Looking at the profile of marks over the past couple of years we can clearly see there has been some stepping back in the profile of marks. Some subjects are back to pre-Covid 2019 profiles. In some subjects, this is more evident than in others. They’ve used the phrase “on aggregate” to hide the stepping back in some subjects and less so in others.
CAO Points 2023 – Slight Deflation
There have been lots of talk and news articles written about Grade Inflation over the past few years (the Covid years) and this year was no different. Most of the discussion this year began a couple of days before the Leaving Cert results were released last week and continued right up to the CAO publishing the points needed for each course. Yes, something needs to be done about the grading profiles and to revert back to pre-Covid levels. There are many reasons why this is necessary. Perhaps the most important of which is to bring back some stability to the Leaving Cert results and corresponding CAOs Points for entry to University courses. Last year, we saw there was some minor stepping back or deflating of results. But this didn’t have much of an impact on points needed for University courses. But in 2023 we have seen a slight step back in the points needed. I mentioned this possibility in my post on the Leaving Cert profile of marks. I also mentioned the subject with the biggest step back in marks/grades was Maths, and it looks like this has had an impact on the CAO point needed.
In 2023, we have seen a drop in points for 60% of University courses. In most years (pre and post-Covid) there would always be some fluctuation of points but the fluctuations would be minor. In 2023, some courses have changed by 20+ points.
The following table and chart illustrate the profile of CAO points and the percentage of students who achieved this in ranges of 50 points.
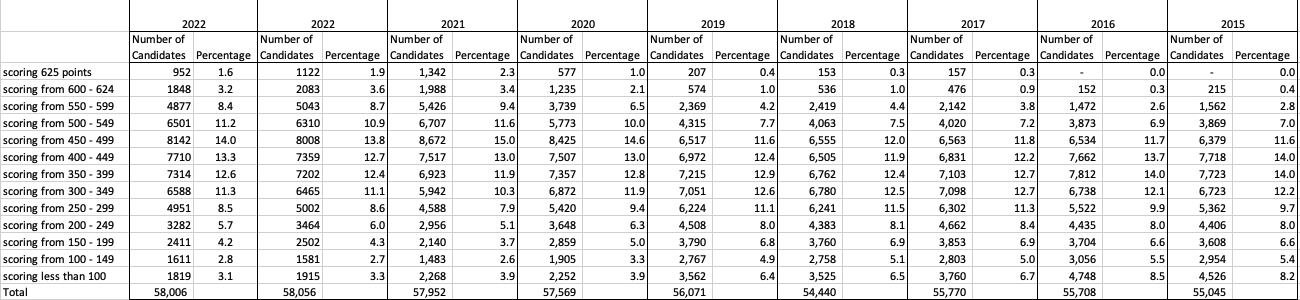

An initial look at the data and the chart it appears the 2023 CAO points profile is very similar to that of 2022. But when you look a little closer a few things stand out. At the upper end of CAO points we see a small reduction in the percentage of students. This is reflected when you look at the range of University courses in this range. The points for these have reduced slightly in 2023 and we have fewer courses using random selection. If you now look at the 300-500 range, we see a slight increase in the percentage of students attaining these marks. But this doesn’t seem to reflect an increase in the points needed to gain entry to a course in that range. This could be due to additional places that Universities have made available across the board. Although there are some courses where there is an increase.
In 2023, we have seen a change in the geographic spread of interest in University courses, with more demand/interest in Universities outside of the Dublin region. The lack of accommodation and their costs in Dublin is a major issue, and students have been looking elsewhere to study and to locations they can easily commute to. Although demand for Trinity and UCD remains strong, there was a drop in the number for TU Dublin. There are many reported factors for this which include the accommodation issue and for those who might have considered commuting, the positioning of the Grangegorman campus in Dublin does not make this easy, unlike Trinity, UCD and DCU.
I’ve the Leaving Cert grades by subject and CAO Points datasets in a Database (Oracle). This allows me to easily analyse the data annually and to compare them to previous years, using a variety of tools.
Leaving Certificate 2023: In-line or more adjustments
The Leaving Certificate results were released this morning. Congratulations to everyone who has completed this major milestone. It’s a difficult set of examinations and despite all the calls to reform the examinations process, it has largely remained unchanged in decades, apart from some minor changes.
Last year (2022) I analysed some of the Leaving Certificate results. This was primarily focused on higher level papers and for a subset of the subjects. Some of these are the core subjects and some of the optional subjects. Just like last year we are told by the Department of Education the results this year will in-aggregate be in-line with last year. This statement is very confusing and also misleading. What does it really mean? No one has given a clear definition or explanation. What it tries to convey is the profile marks by subject are the same as last year. We say last year this was Not the case and we saw some grade deflation back towards the pre-Covid profile. Some though a similar stepping back this year, just like we have seen in the UK and other European countries.
The State Examinations Commission has released the break down of numbers and percentages of student who were awarded each grade by students. There are lots of ways to analyse this data from using Python and other Data Analytics tools, but for me I’ve loaded the data into an Oracle Database, and used Oracle Analytics Cloud to do some of the analysis along with other tools.
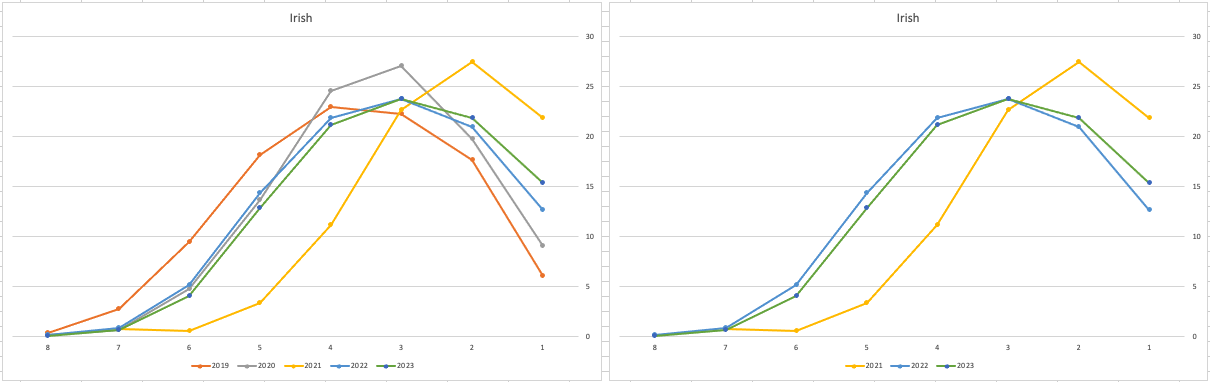
Let’s start with the core exam subjects of Irish, English and Maths. For Irish, last year we saw a step back in the profile of marks. This was a significant step back towards the marks in 2019 (pre-Covid). There wasn’t much discussion about this last year, and perhaps one of the reason is Irish is typically not counted towards their CAO points, as it is typically one of the weaker subjects for a lot of students. This year the profile of marks for Irish is in-line with last year’s profile (+/- small percentages) with slight up tick in H1 grades. For English, the profile of marks for 2021, 2022 and 2023 are almost exactly the same. But for Maths we do see a step back (moving the the left in the figure below) with a significantly lower percentage of student achieving a H2 or H1. Although we do see a slight increase in those getting H4 and H3 grades There was some problems with one of the Maths papers and perhaps marks were not adjusted due to those issues, which isn’t right to me as something should have been done. But perhaps a decision was made to all this step back in Maths to reduce the number of students achieving the top points of 625 and avoiding the scenario where those student do not get their first choice course for university.
The SEC have said the following about the marking of Maths Paper 1. “This process resulted in a marking scheme that was at the more lenient end of the normal range“. Even with more lenient marking and grade adjustments the profile of marks has taken a step backwards. This does raise question about how lenient they were or no and if the post mark adjusts took into account last year’s profile, or they are looking to step back to pre-Covid profiles.
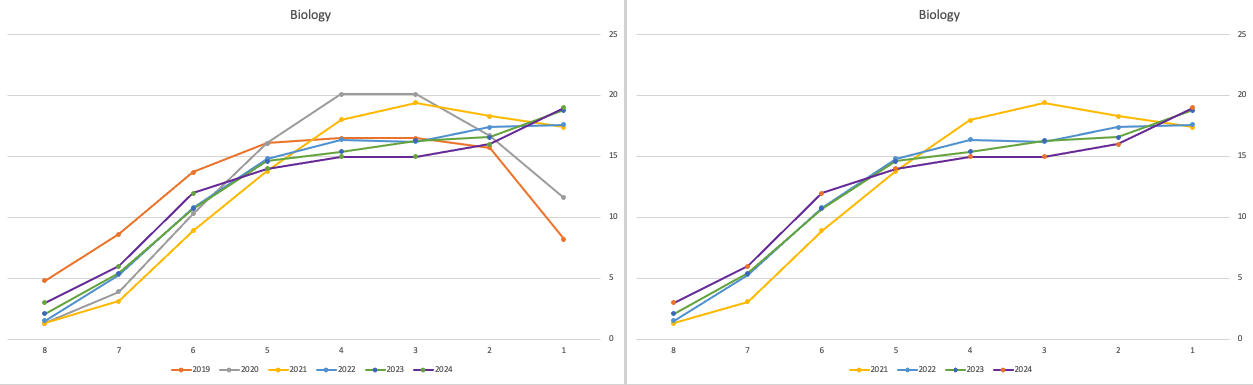
When we look at the Science students of Physics, Chemistry and Biology, we can see the profile of marks for this year is broadly in line with last years (2022). When looking at the profiles for these subjects, we can see that they are very similar to the pre-Covid profiles. Although there are some minor differences. We are still seeing an increased level H1s across this students when compared to pre-Covid 2019 levels. With lower grades having a slightly smaller percentage profile when compared to pre-Covid 2019 level. Look at the profiles 2022 and 2023 are broadly in-line with with 2019 (with some minor variations).
There are more subjects to report upon, but those listed above will cover most students.
What do these results and profile of marks mean for students looking to go to University or further education where the courses are based on the CAO Points systems. It looks like the step back in grade profile for Maths will have the biggest impact on CAO Points for courses. This will particularly impact those courses in the 525-625 range in 2022. We could see a small drop in marks for courses in that range with a possible drop of up to 10 points for some of those courses.
For courses in the 400-520 range in 2022, we might see a small increase in marks. Again this might be due to the profile of marks in Maths, but also with some of the other optional subjects. This year we could see a slight increase of 5-15 points for those courses.
Time will tell if these predictions come true, and hopefully every student will get the course they are hoping for as the nervous wait for CAO Round 1 offers commece. (Wednesday 30th August). I’ll have another post looking at the CAO Points profiles, so look out for that.
Leaving Cert 2022 Results – Inflation, deflation or in-line!
The Leaving Certificate 2022 results are out. Up and down the country there are people who are delighted with their results, while others are disappointed, and lots of other emotions.
The Leaving Certificate is the terminal examination for secondary education in Ireland, with most students being examined in seven subjects, with their best six grades counting towards their “points”, which in turn determines what university course they might get. Check out this link for learn more about the Leaving Certificate.
The Dept of Education has been saying, for several months, this results this year (2022) will be “in-line on aggregate” with the results from 2021. There has been some concerns about grade inflation in 2021 and the impact it will have on the students in 2022 and future years. At some point the Dept of Education needs to address this grade inflation and look to revert back to the normal profile of grades pre-Covid.
Let’s have a look to see if this is true, and if it is true when we look a little deeper. Do the aggregate results hide grade deflation in some subjects.
For the analysis presented in this blog post, I’ve just looked at results at Higher Level across all subjects, and for the deeper dive I’ll look at some of the most popular subjects.
Firstly let’s have a quick look at the distribution of grades by subject for 2022 and 2021.
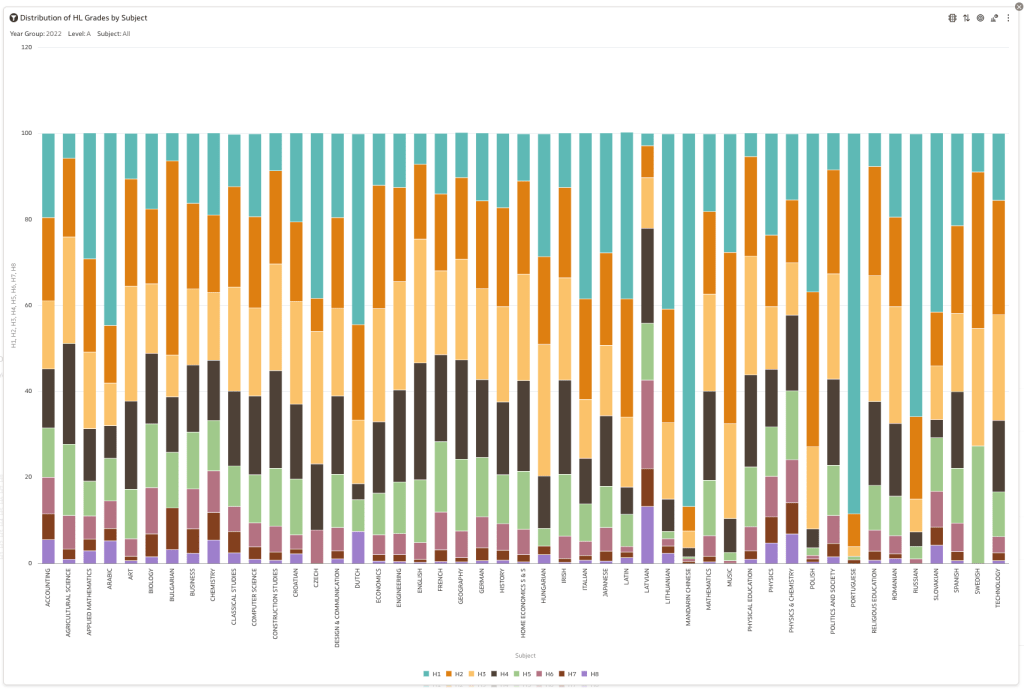
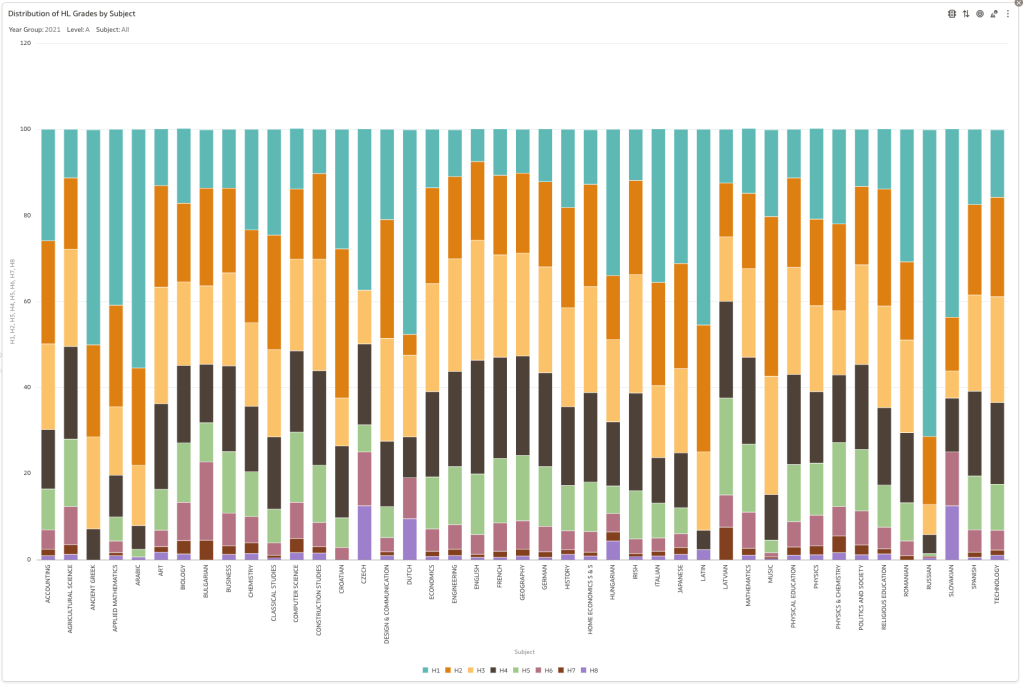
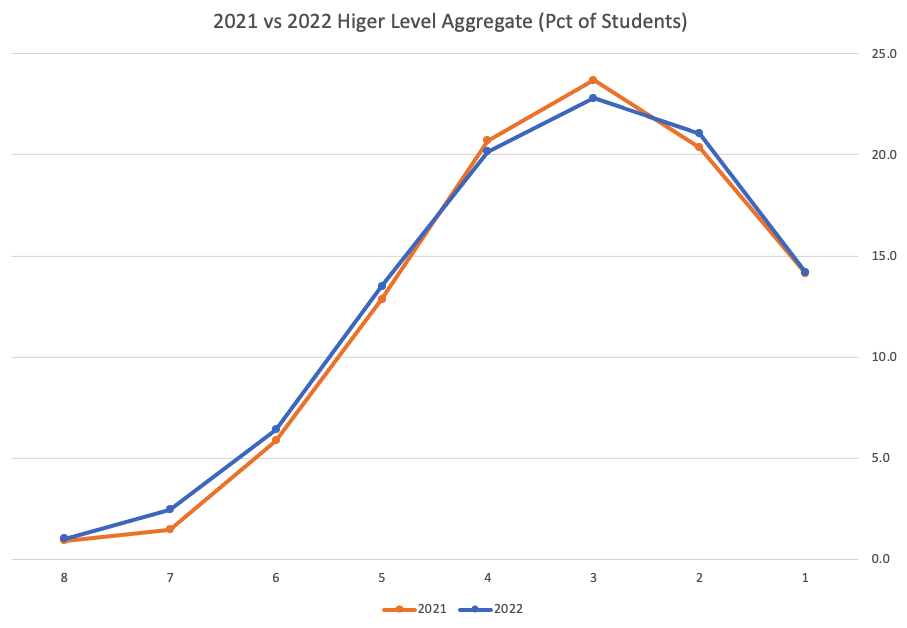
Remember the Dept of Education said the 2022 results should be in-line with the results of 2021. This required them to apply some adjustments, after marking the exam scripts, to give an updated profile. The following chart shows this comparison between the two years. On initial inspection we can see it is broadly similar. This is good, right? It kind of is and at a high level things look broadly in-line and maybe we can believe the Dept of Education. Looking a little closer we can see a small decrease in the H2-H4 range, and a slight increase in the H5-H8.
Let’s dive a little deeper. When we look at the grade profile of students in 2021 and 2022, How many subjects increased the number of students at each grade vs How many subjects decreased grades vs How many approximately stated the same. The table below shows the results and only counts a change if it is greater than 1% (to allow for minor variations between years).
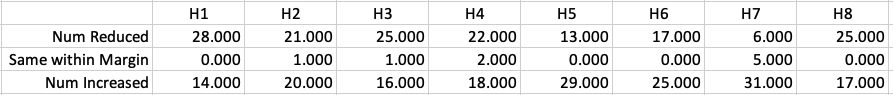
This table in very interesting in that more subjects decreased their H1s, with some variation for the H2-H4s, while for the lower range of H5-H7 we can see there has been an increase in grades. If I increased the margin to 3% we get a slightly different results, but only minor changes.
“in-line on aggregate” might be holding true, although it appears a slight increase on the numbers getting the lower grades. This might indicate either more of an adjustment to weaker students and/or a bit of a down shifting of grades from the H2-H4 range. But at the higher end, more subjects reduced than increase. The overall (aggregate) numbers are potentially masking movements in grade profiles.
Let’s now have a look at some of the core subjects of English, Irish and Mathematics.
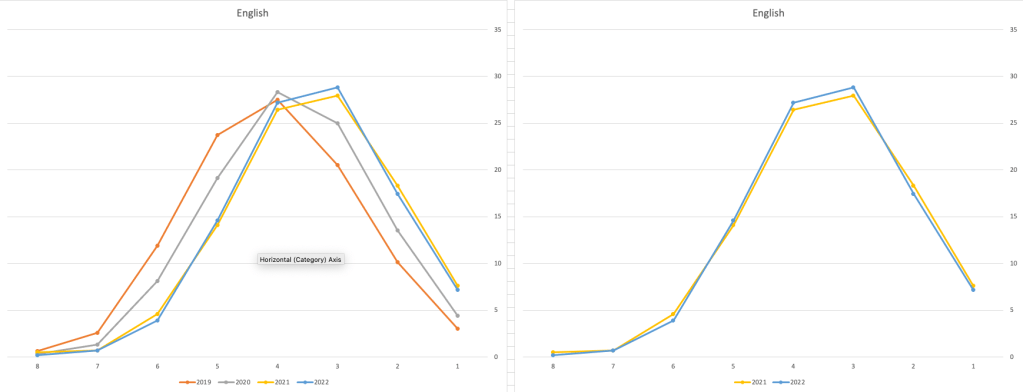
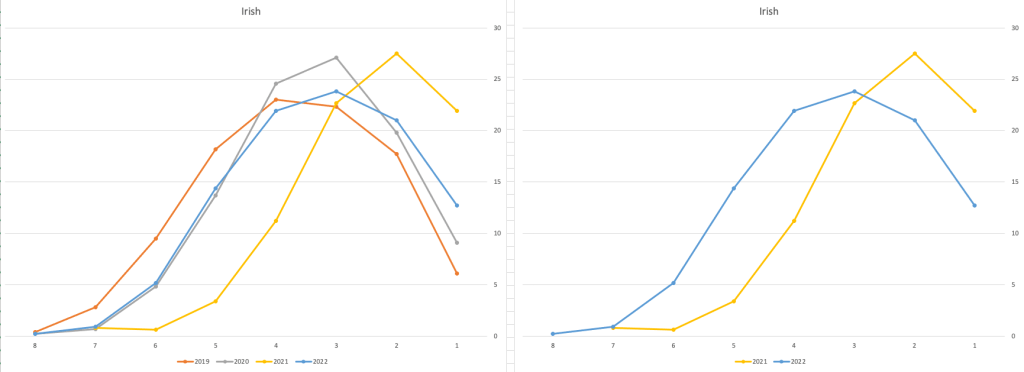
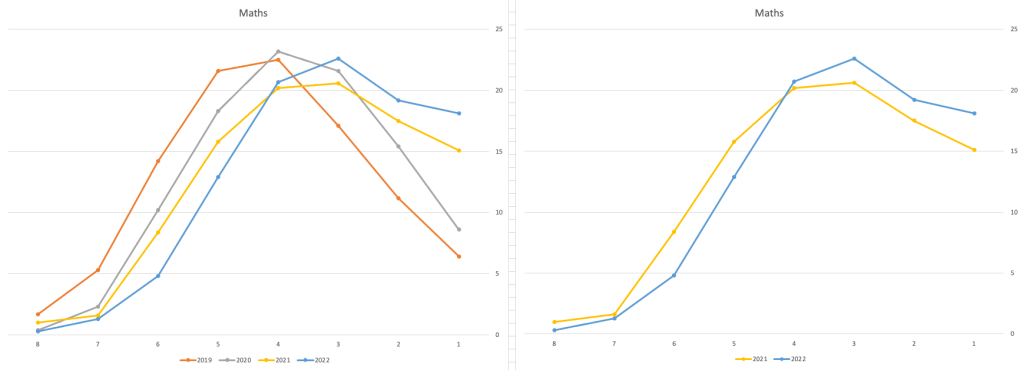
For English, it looks like they fitted to the curve perfectly! keeping grades in-line between the two years. Mathematics is a little different with a slight increase in grades. But when you look at Irish we can see there was definite grade deflation. For each of these subjects, the chart on the left contains four years of data including 2019 when the last “normal” leaving certificate occurred. With Irish the grade profile has been adjusted (deflated) significantly and is closer to 2019 profile than it is to 2021. There was been lots and lots of discussions nationally about how and when grades will revert to normal profile. The 2022 profile for Irish seems to show this has started to happen in this subject, which raises the question if this is occurring in any other subjects, and is hidden/masked by the “in-line on aggregate” figures.
This blog post would become just too long if I was to present the results profile for each of the 42+ subjects.
Let’s have a look as two of the most common foreign languages, French and Spanish.
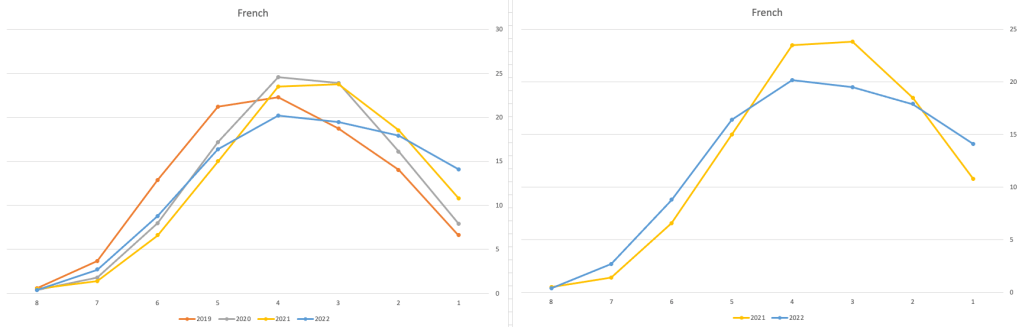
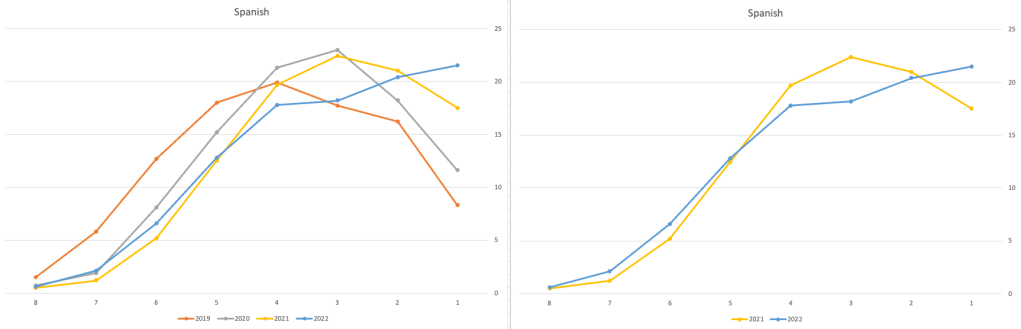
Again we can see some grade deflation, although not to be same extent as Irish. For both French and Spanish, we have reduced numbers for the H2-H4 range and a slight increase for H5-H7, and shift to the left in the profile. A slight exception is for those getting a H1 for both subjects. The adjustment in the results profile is more pronounced for French, and could indicate some deflation adjustments.
Next we’ll look at some of the science subjects of Physics, Chemistry and Biology.
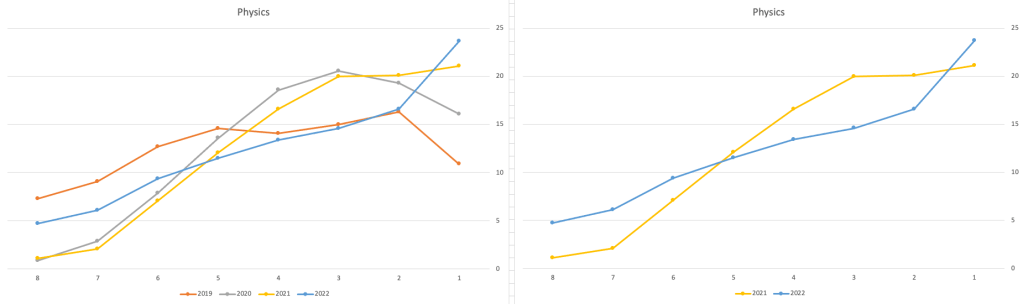
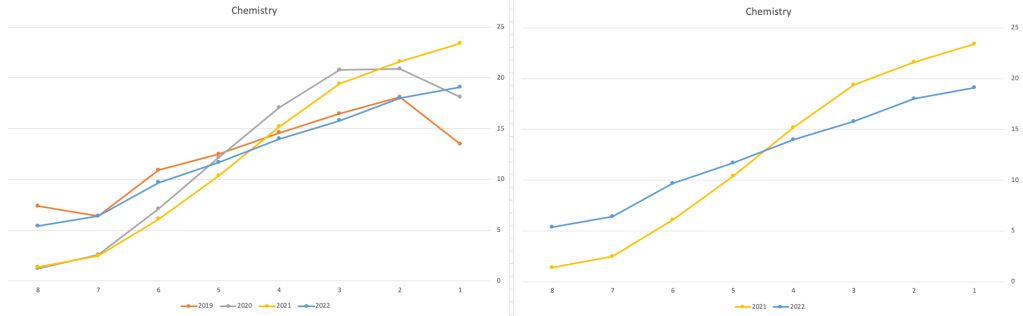
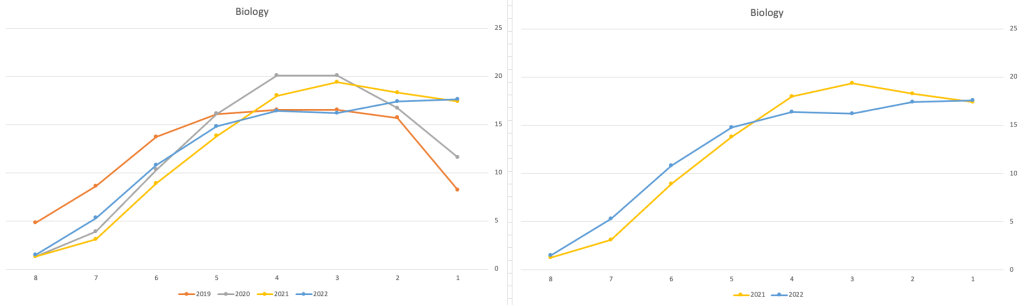
These three subjects also indicate some adjusts back towards the pre-Covid profile, with exception of H1 grades. We can see the 2022 profile almost reflect the 2019 profile (excluding H1s) and for Biology appears to be at a half way point between 2019 and 2022 (excluding H1s)
Just one more example of grade deflation, and this with Design, Communication and Graphics (or DCG)
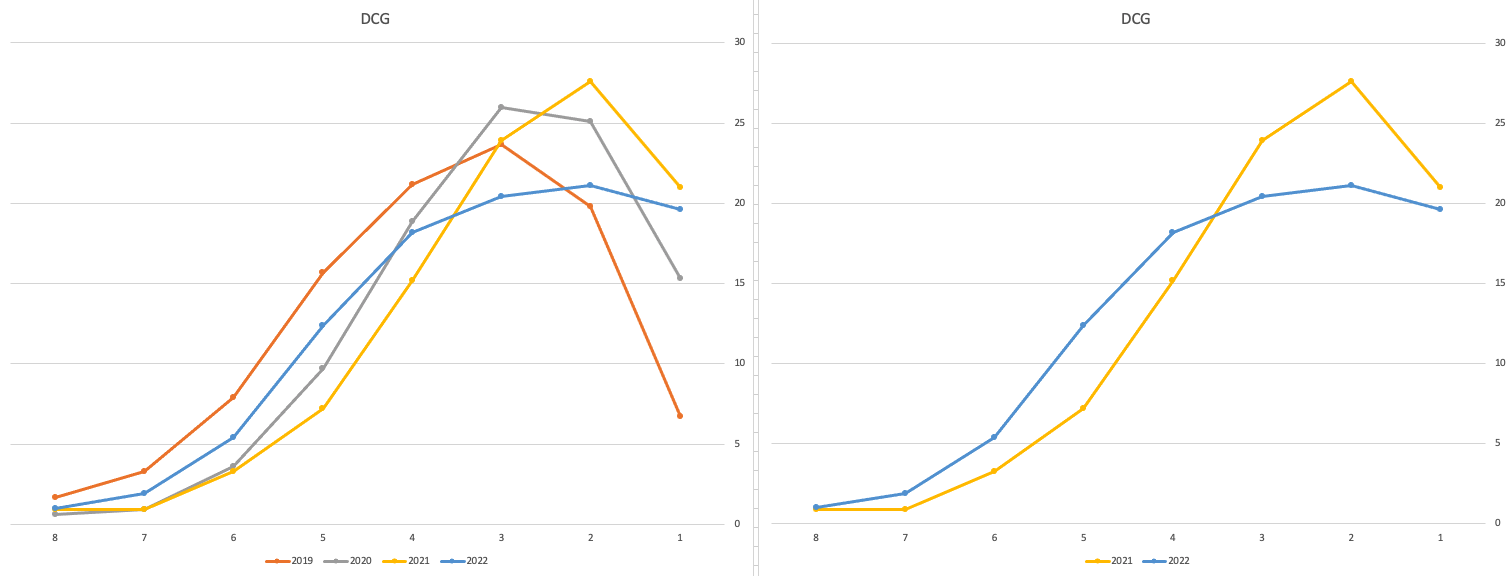
Yes there is obvious grade deflation and almost back to 2019 profile, with the exception of H1s again.
I’ve mentioned some possible grade deflation in various subjects, but there are also subjects where the profile very closely matches the 2021 profile. We have seen above English is one of those. Others include Technology, Art and Computer Science.
I’ve analyzed many more subjects and similar shifting of the profile is evident in those. Has the Dept of Education and State Examinations Commission taken steps to start deflating grades from the highs of 2021? I’d said the answer lies in the data, and the data I’ve looked at shows they have started the deflation process. This might take another couple of years to work out of the system and we will be back to “normal” pre-covid profiles. Which raises another interesting question, Was the grade profile for subjects, pre-covid, fitted to the curve? For the core set of subjects and for many of the more popular subjects, the data seems to indicate this. Maybe the “normal” distribution of marks is down to the “normal” distribution of abilities of the student population each year, or have grades been normalised in some way each year, for years, even decades?
For this analysis I’ve used a variety of tools including Excel, Python and Oracle Analytics.
The Dataset used can be found under Dataset menu, and listed as ‘Leaving Certificate 2015-2022’. An additional Dataset, I’ll be adding soon, will be for CAO Points Profiles 2015-2022.

You must be logged in to post a comment.