
Measuring Skewness of Data in Oracle (21c)
When analyzing data you will look at using a variety of different statistical functions to explore variable data insights.
One of these is the Skewness of the data.
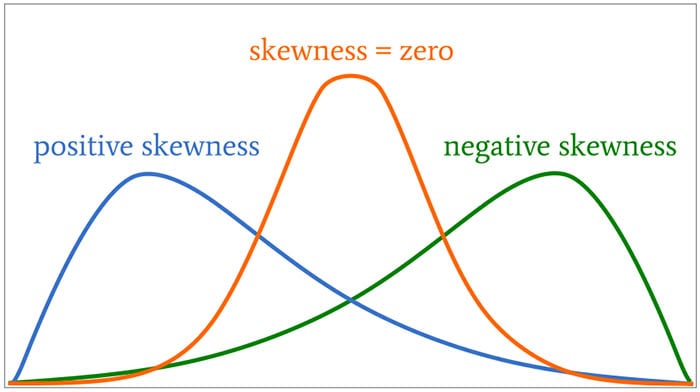
Skewness is a measure of the asymmetry of the probability distribution about its mean. This looks a the tail of the data, with a positive value indicating the tail on the right side of the distribution, and a negative value when the tail is on the left hand side. A zero value indicates the tails on both side balance out, as shown in the following image.
Most SQL dialects support Skewness using with an inbuilt function. But if it doesn’t then you would need to write your own version of the calculation, for example using the following.
SELECT avg(SV) S_value
FROM   (SELECT  power((age – avg(age) over ())/stddev(age) over (), 3) SV
        FROM    cust_data)
Here are charts illustrating the data in my table. These include the distributions for the AGE and DURATION attributes.
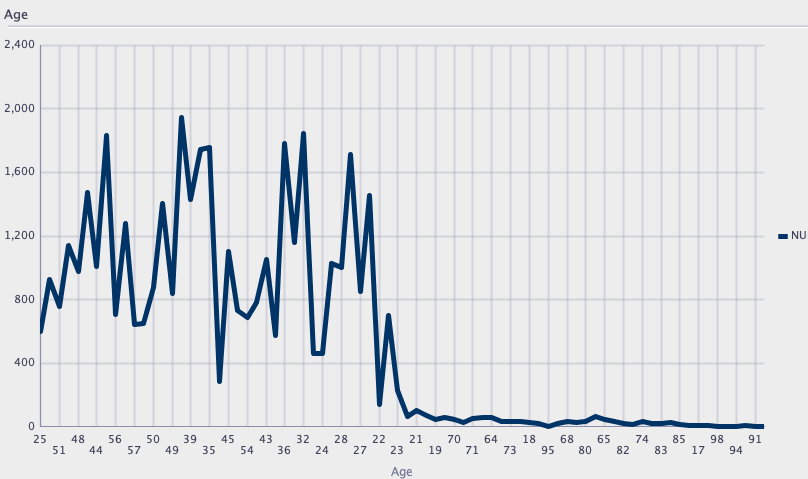

We can see the data is skewed. When we run the above code we get the following values.
Age = 0.78
Duration = 3.26
We can see the skewness of Duration is significantly longer, giving a positive value as the skewness is to the right.
In Oracle 21s we now have new Skewness functions called SKEWNESS_POP and SKEWNESS_SAMP. The POP version of the function considers all records, where as the SAMP function considers a sample of the records. When your data set grows into many millions of records the SKEWNESS_SAMP will give a quicker response as it works with a sample of the data set
Both functions will give similar values but at the number of input records the returned values will returned will converge.
SELECT skewness_pop(age), skewness_samp(age)
FROM cust_data;
SELECT skewness_pop(duration), skewness_samp(duration)
FROM cust_data;

