
Comparing Cluster Algorithms on Density Data
In a previous posted I gave a detailed description of using DBScan to create clusters for a dataset containing different density based data. This “manufactured” dataset was created to illustrate how and why DBScan can be used.
But taking the previous post in isolation is perhaps not recommended. As a Data Scientist you will need to use many Clustering algorithms to determine which algorithm can best identify the patterns in your data, and this can be determined by the type of data distributions within the dataset.
The DBScan post created the following diagrams. The diagram on the left is a plot of the dataset where we can easily identify different groupings/clusters. The diagram on the right illustrates the clusters identified by DBScan. As you can see it did a good job.
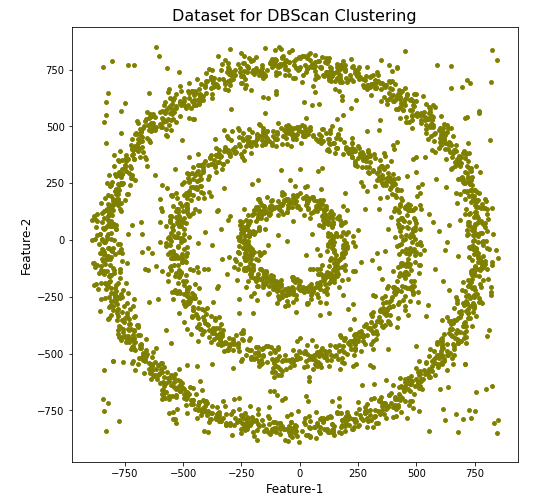
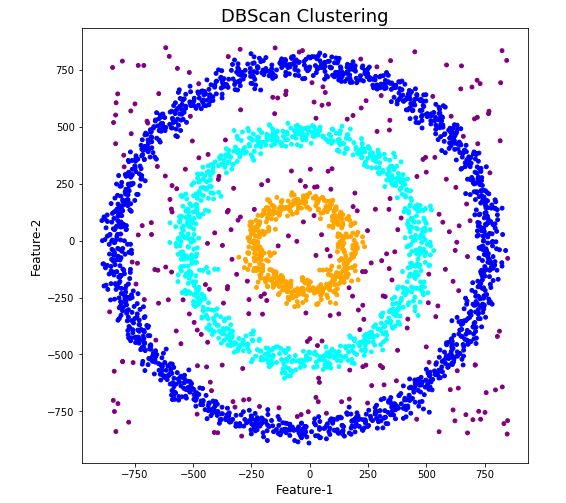
We can see the three clusters and the noisy data point which were added to the dataset.
But what about other Clustering algorithms? What about k-Means and Hierarchical Clustering algorithms? How would they perform on this dataset?
Here is the code for k-Means with three clusters. Three clusters was selected as we have three clear clusters in the dataset.
#k-Means with 3 clusters
from sklearn.cluster import KMeans
k_means=KMeans(n_clusters=3,random_state=42)
k_means.fit(df[[0,1]])

df['KMeans_labels']=k_means.labels_

# Plotting resulting clusters
colors=['purple','red','blue','green']
plt.figure(figsize=(10,10))
plt.scatter(df[0],df[1],c=df['KMeans_labels'],cmap=matplotlib.colors.ListedColormap(colors),s=15)
plt.title('K-Means Clustering',fontsize=18)
plt.xlabel('Feature-1',fontsize=12)
plt.ylabel('Feature-2',fontsize=12)
plt.show()
Here is the code for Hierarchical Clustering, again three clusters was selected.
from sklearn.cluster import AgglomerativeClustering
model = AgglomerativeClustering(n_clusters=3, affinity='euclidean')
model.fit(df[[0,1]])

df['HR_labels']=model.labels_

# Plotting resulting clusters
plt.figure(figsize=(10,10))
plt.scatter(df[0],df[1],c=df['HR_labels'],cmap=matplotlib.colors.ListedColormap(colors),s=15)
plt.title('Hierarchical Clustering',fontsize=20)
plt.xlabel('Feature-1',fontsize=14)
plt.ylabel('Feature-2',fontsize=14)
plt.show()
The diagrams from both of these are shown below.
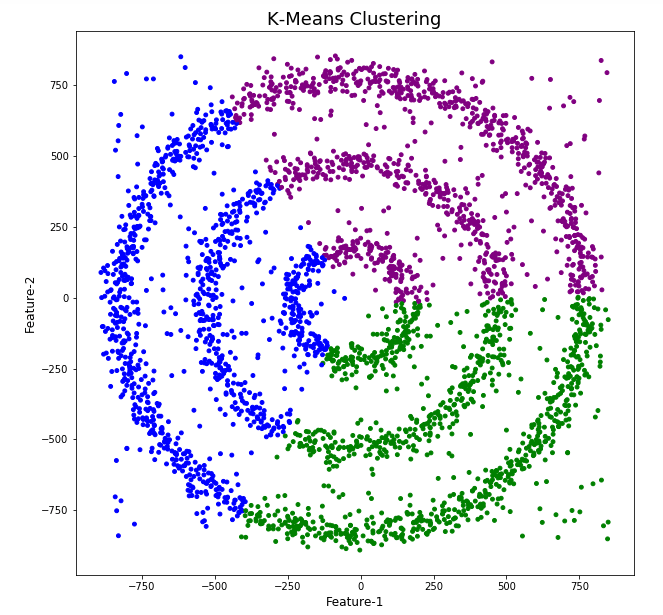
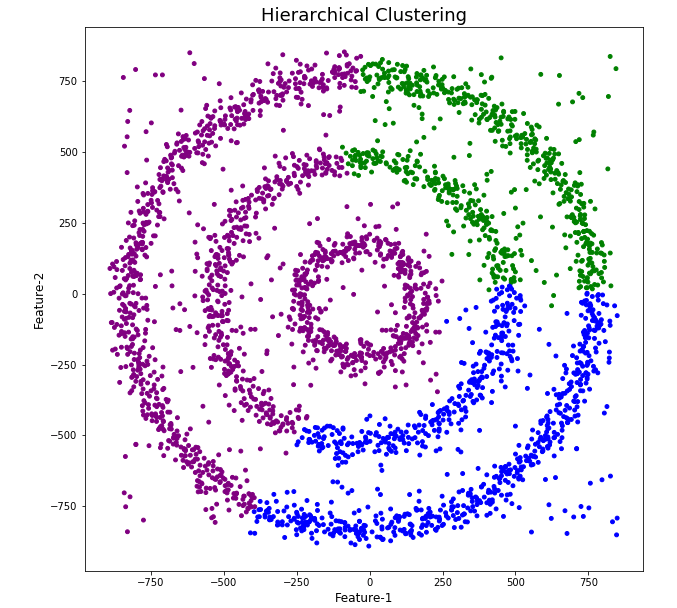
As you can see the results generated by these alternative Clustering algorithms produce very different results to what was produced by DBScan (see image at top of post) and we can easily see which algorithm best fits the dataset used.
Make sure you check out the post on DBScan.
