
PostgreSQL
Annual Look at Database Trends (Jan 2023)
Monitoring trends in the popularity and usage of different Database vendors can be a interesting exercise. The marketing teams from each vendor do an excellent job of promoting their Database, along with the sales teams, developer advocates, and the user communities. Some of these are more active than others and it varies across the Database market on what their choice is for promoting their products. One of the problems with these various types of marketing, is how can be believe what they are saying about how “awesome” their Database is, and then there are some who actively talk about how “rubbish” (or saying something similar) other Databases area. I do wonder how this really works for these people and vendors when to go negative about their competitors. A few months ago I wrote about “What does Legacy Really Mean?“. That post was prompted by someone from one Database Vendor calling their main competitor Database a legacy product. They are just name calling withing providing any proof or evidence to support what they are saying.
Getting back to the topic of this post, I’ve gathered some data and obtained some league tables from some sites. These will help to have a closer look at what is really happening in the Database market throughout 2022. Two popular sites who constantly monitor the wider internet and judge how popular Databases area globally. These sites are DB-Engines and TOPDB Top Database index. These are well know and are frequently cited. Both of these sites give some details of how they calculate their scores, with one focused mainly on how common the Database appears in searches across different search engines, while the other one, in addition to search engine results/searches, also looks across different websites, discussion forms, social media, job vacancies, etc.
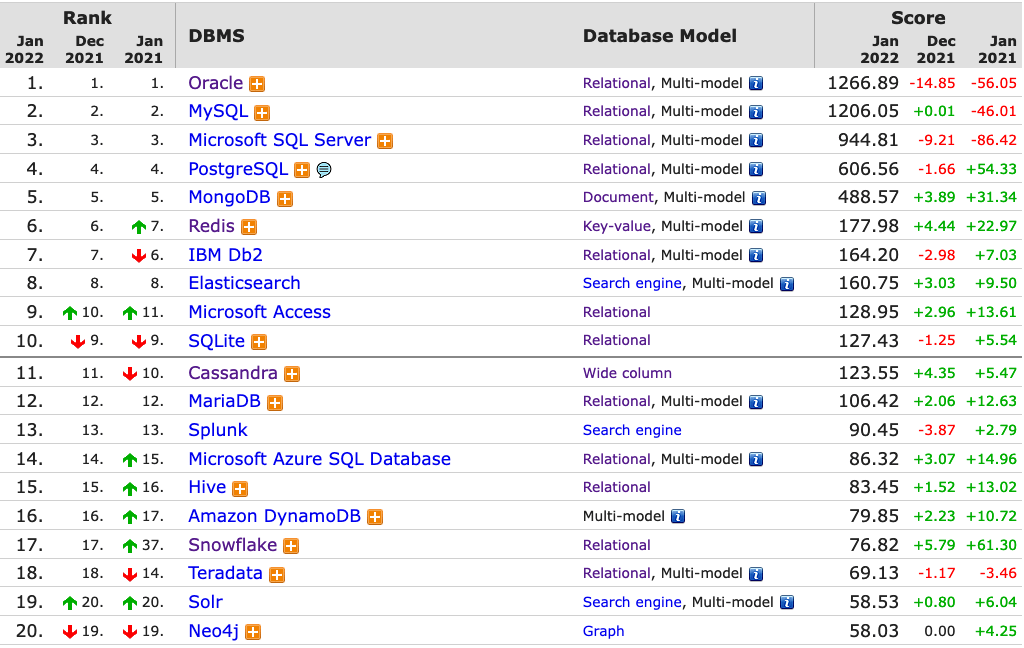
The first image below is a comparison of the league tables from DB-Engines taken in January 2022 and January 2023. I’ve divided this image into three sections/boxes. Overall for the first 10 places, not a lot has changed. The ranking scores have moved slightly in most cases but not enough to change their position in the rank. Even with a change of score by 30+ points is a very small change and doesn’t really indicate any great change in the score as these scores are ranked in a manner where, “when system A has twice as large a value in the DB-Engines Ranking as system B, then it is twice as popular when averaged over the individual evaluation criteria“. Using this explanation, Oracle would be twice as popular when compared to PostgreSQL. This is similar across 2022 and 2023.

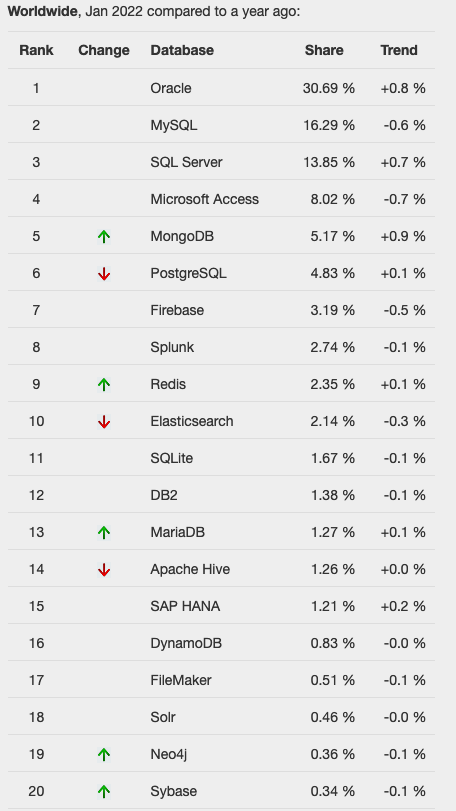
Next we’ll look a ranking from TOPDB Top Database index. The image below compares January 2022 and January 2023. TOPDB uses a different search space and calculation for its calculation. The rankings from TOPDB do show some changes in the ranks and these are different to those from DB-Engines. Here we see the top three ranks remain the same with some small percentage changes, and nothing to get excited about. In the second box covering ranks 4-7 we do some changes with PostgreSQL improving by two position and MongoDB. These changes do seem to reflect what I’ve been seeing in the marketplace with MongoDB being replaced by PostgreSQL and MySQL, with this multi-model architecture where you can have relational, document, and other data models in the one Database. It’s important to note Oracle and SQL Server also support this. Over the past couple of years there has been a growing awareness of and benefits of having relation and document (and others) data models in the one database. This approach makes sense both for developer productivity, and for data storage and management.

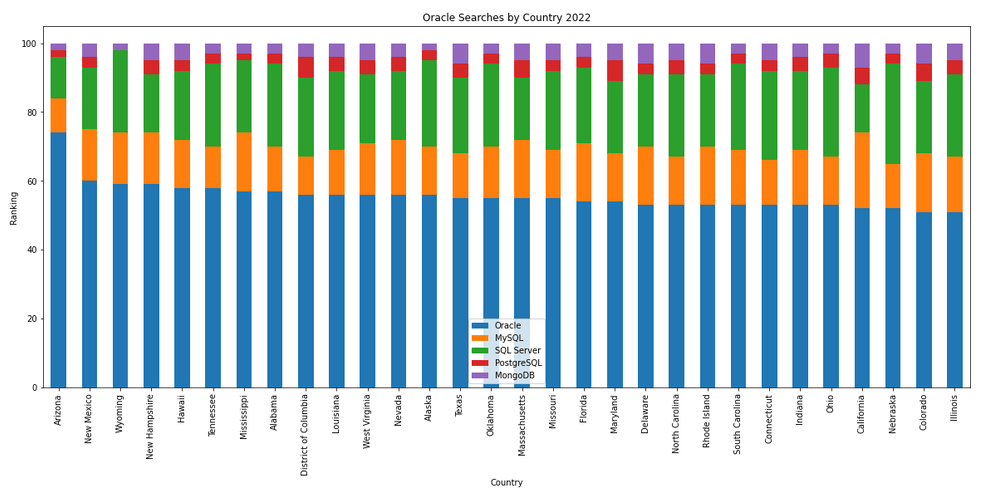
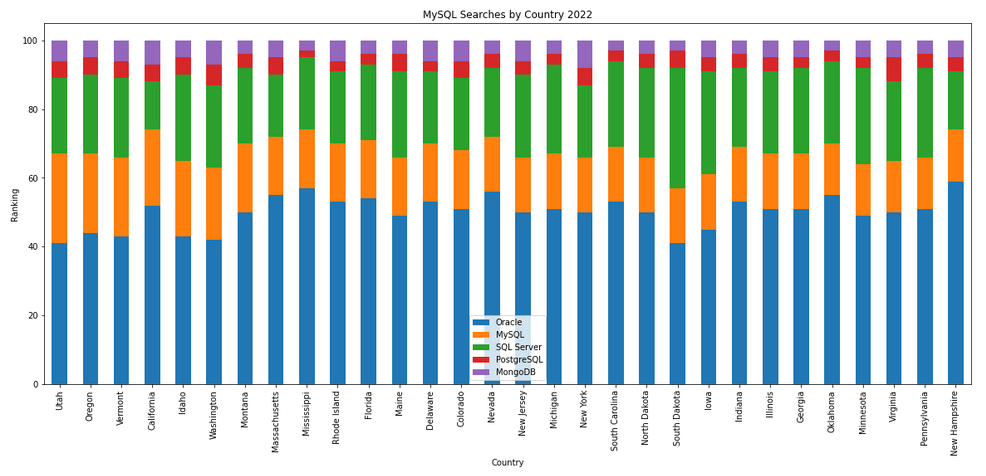
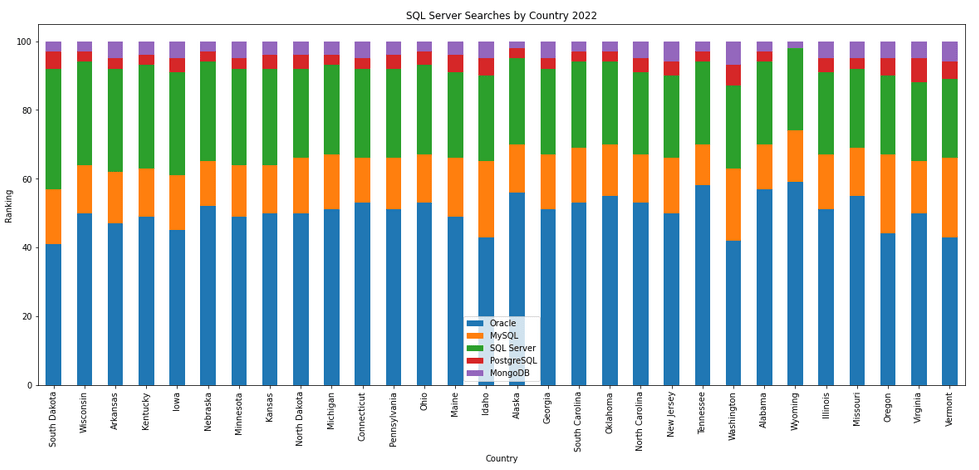
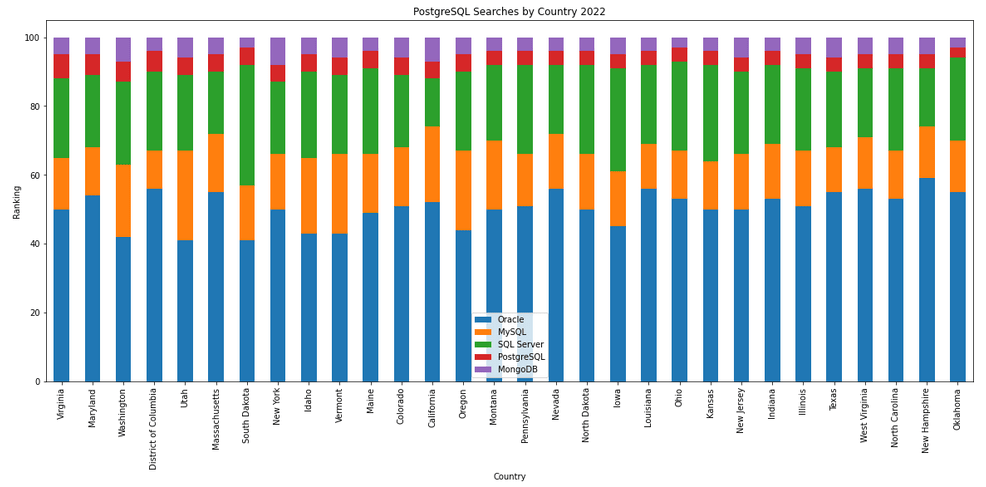
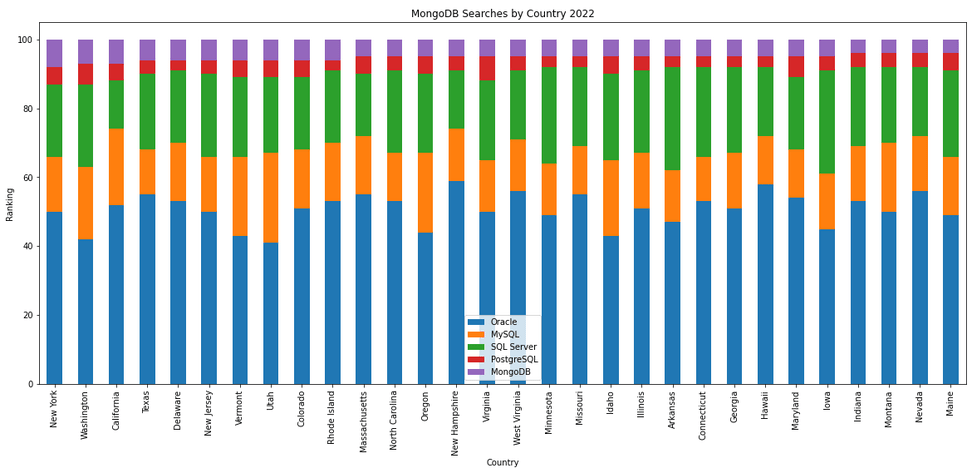
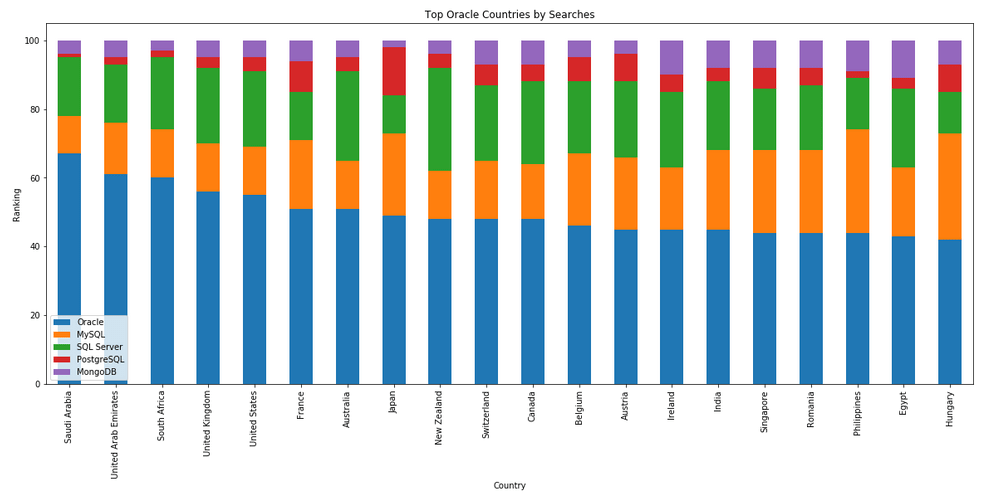
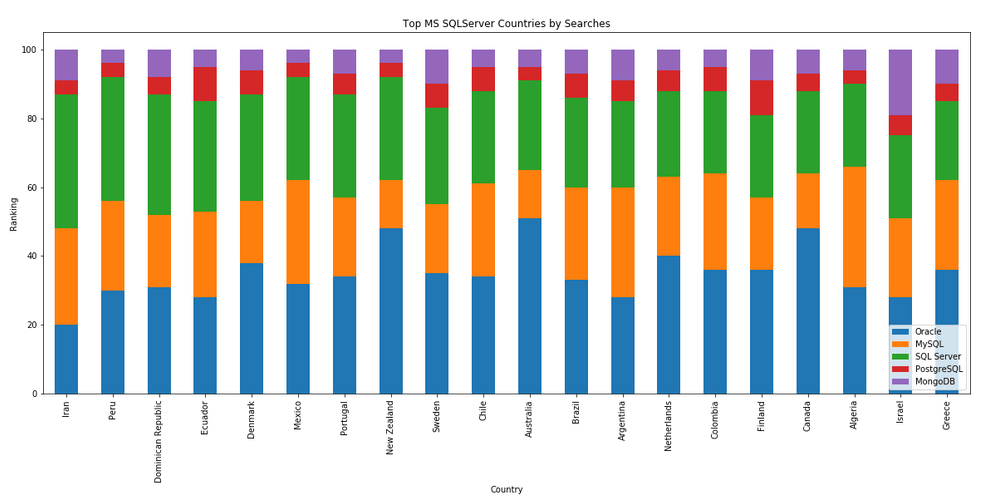
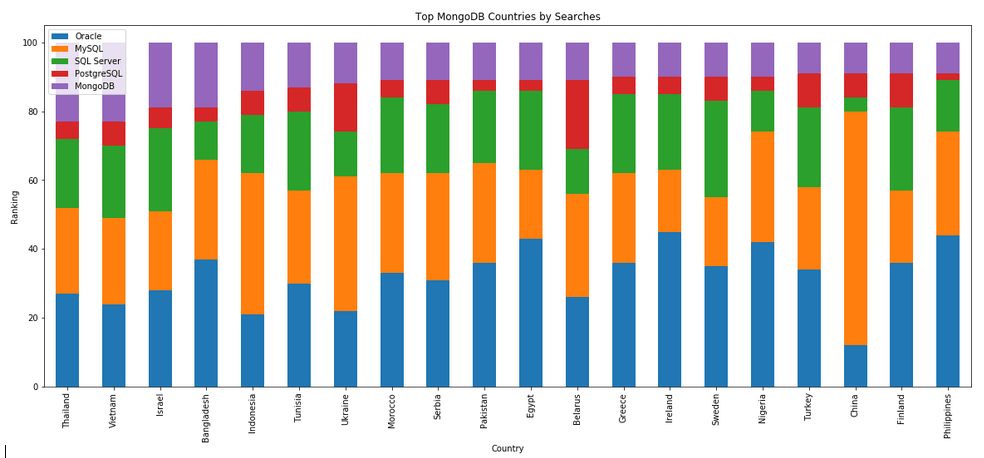
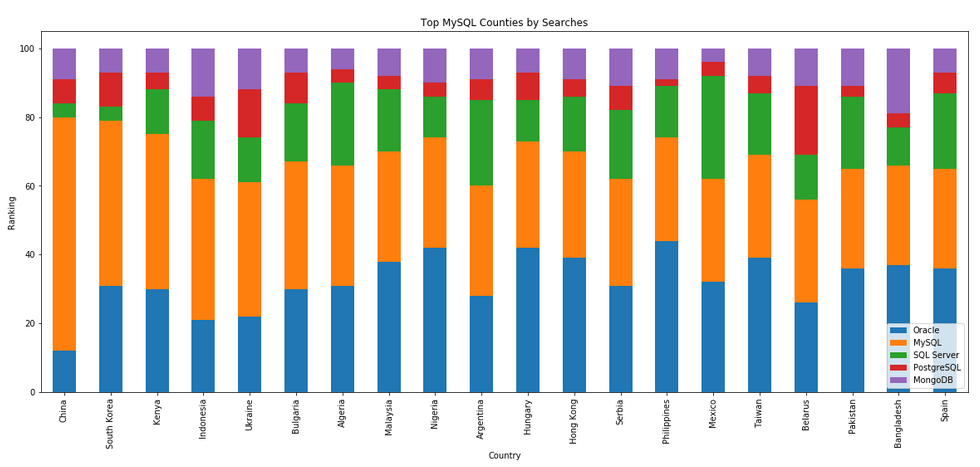
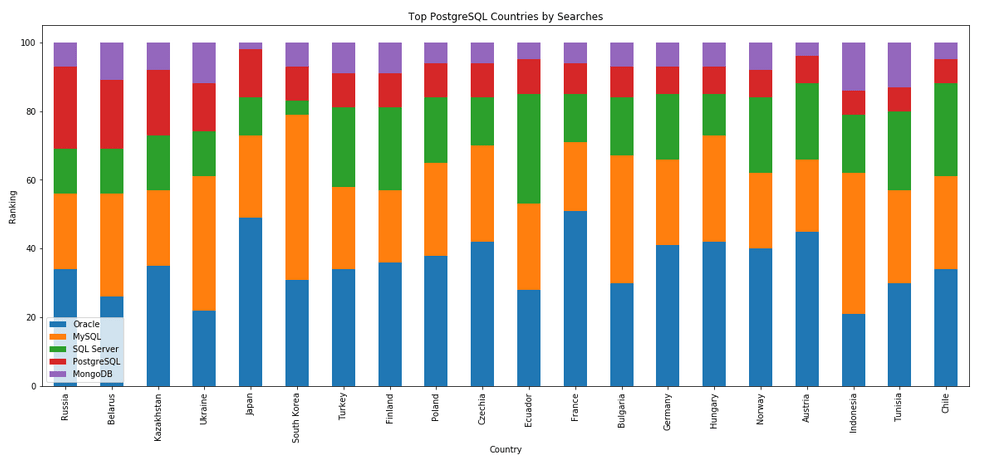
The next gallery of images is based on some Python code I’ve written to look a little bit closer at the top five Databases. In this case these are Oracle, MySQL, SQL Server, PostgreSQL and MongoDB. This gallery plots a bar chart for each Database for their top 15 Counties, and compares them with the other four Databases. The results are interesting and we can see some geographic aspects to the popularity of the Databases.
Postgres on Docker
Prostgres is one of the most popular databases out there, being used in Universities, open source projects and also widely used in the corporate marketplace. I’ve written a previous post on running Oracle Database on Docker. This post is similar, as it will show you the few simple steps to have a persistent Postgres Database running on Docker.
The first step is go to Docker Hub and locate the page for Postgres. You should see something like the following. Click through to the Postgres page.

There are lots and lots of possible Postgres images to download and use. The simplest option is to download the latest image using the following command in a command/terminal window. Make sure Docker is running on your machine before running this command.
docker pull postgresAlthough, if you needed to install a previous release, you can do that.

After the docker image has been downloaded, you can now import into Docker and create a container.
docker run --name postgres -p 5432:5432 -e POSTGRES_USER=postgres -e POSTGRES_PASSWORD=pgPassword -e POSTGRES_DB=postgres -d postgresImportant: I’m using Docker on a Mac. If you are using Windows, the format of the parameter list is slightly different. For example, remove the = symbol after POSTGRES_DB
If you now check with Docker you’ll see Postgres is now running on post 5432.

Next you will need pgAdmin to connect to the Postgres Database and start working with it. You can download and install it, or run another Docker container with pgAdmin running in it.
First, let’s have a look at installing pgAdmin. Download the image and run, accepting the initial requirements. Just let it run and finish installing.


When pgAdmin starts it looks for you to enter a password. This can be anything really, but one that you want to remember. For example, I set mine to pgPassword.
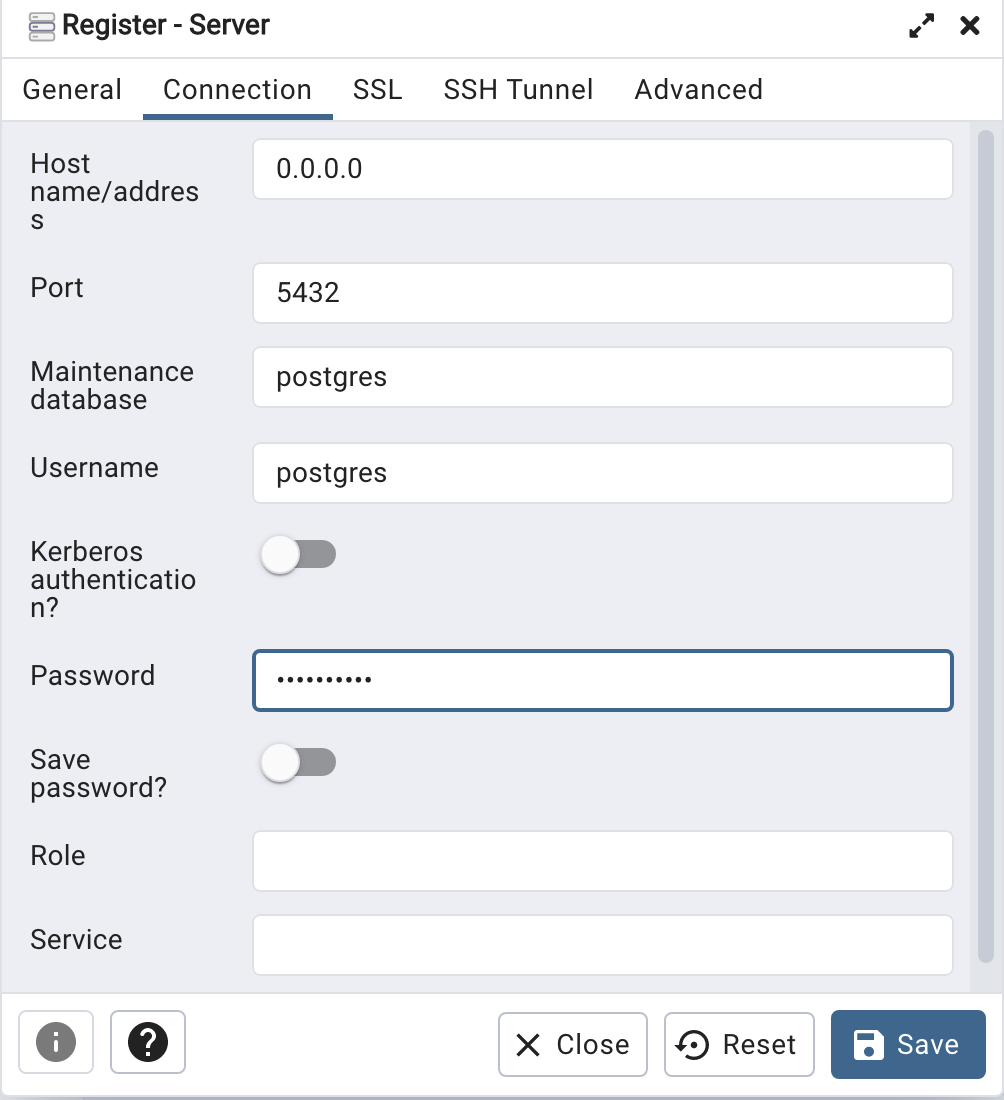
Then create (or Register) a connection to your Postgres Database. Enter the details you used when creating the docker image including username=postgres, password=pgPassword and IP address=0.0.0.0.
The IP address on your machine might be a little different, and to check what it is, run the following
docker ps -a


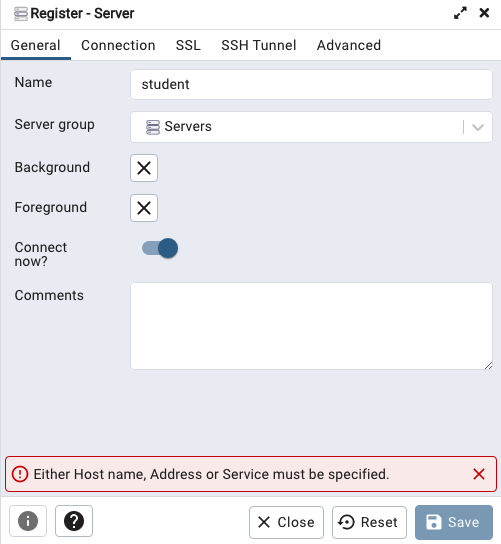
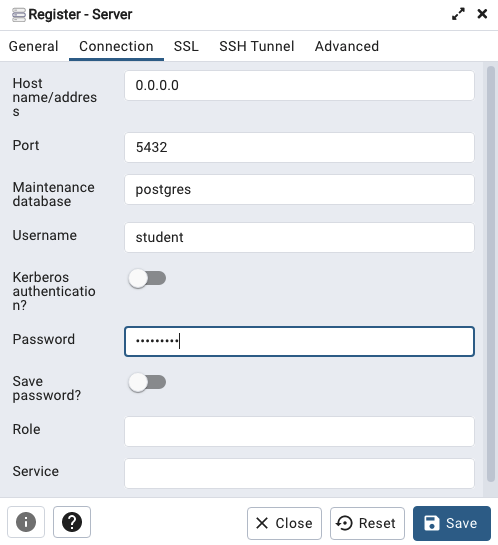
When your (above) connection works, the next step is to create another schema/user in the database. The reason we need to do this is because the user we connected to above (postgres) is an admin user. This user/schema should never be used for database development work.
Let’s setup a user we can use for our development work called ‘student’. To do this, right click on the ‘postgres’ user connection and open the query tool.
Then run the following.

After these two commands have been run successfully we can now create a connection to the postgres database, open the query tool and you’re now all set to write some SQL.

Database Vendors on Twitter, Slack, downloads, etc.
Each year we see some changes in the positioning of the most popular databases on the market. “The most popular” part of that sentence can be the most difficult to judge. There are lots and lots of different opinions on this and ways of judging them. There are various sites giving league tables, and even with those some people don’t agree with how they perform their rankings.
The following table contains links for some of the main Database engines including download pages, social media links, community support sites and to the documentation.
One of the most common sites is DB-Engines, and another is TOPDB Top Database index. The images below show the current rankings/positions of the database vendors (in January 2022).
I’ve previously written about using the Python pytrends package to explore the relative importance of the different Database engines. The results from pytrends gives results based on number of searches etc in Google. Check out that Blog Post. I’ve rerun the same code for 2021, and the following gallery displays charts for each Database based on their popularity. This will allow you to see what countries are most popular for each Database and how that relates to the other databases. For these charts I’ve included Oracle, MySQL, SQL Server, PostgreSQL and MongoDB, as these are the top 5 Databases from DB-Engines.
Exploring Database trends using Python pytrends (Google Trends)
A little word of warning before you read the rest of this post. The examples shown below are just examples of what is possible. It isn’t very scientific or rigorous, so don’t come complaining if what is shown doesn’t match your knowledge and other insights. This is just a little fun to see what is possible. Yes a more rigorous scientific study is needed, and some attempts at this can be seen at DB-Engines.com. Less scientific are examples shown at TOPDB Top Database index and that isn’t meant to be very scientific.
After all of that, here we go 🙂
pytrends is a library providing an API to Google Trends using Python. The following examples show some ways you can use this library and the focus area I’ll be using is Databases. Many of you are already familiar with using Google Trends, and if this isn’t something you have looked at before then I’d encourage you to go have a look at their website and to give it a try. You don’t need to run Python to use it. For example, here is a quick example taken from the Google Trends website. Here are a couple of screen shots from Google Trends, comparing Relational Database to NoSQL Database. The information presented is based on what searches have been performed over the past 12 months. Some of the information is kind of interesting when you look at the related queries and also the distribution of countries.


To install pytrends use the pip command
pip3 install pytrends
As usual it will change the various pendent libraries and will update where necessary. In my particular case, the only library it updated was the version of pandas.
You do need to be careful of how many searches you perform as you may be limited due to Google rate limits. You can get around this by using a proxy and there is an example on the pytrends PyPi website on how to get around this.
The following code illustrates how to import and setup an initial request. The pandas library is also loaded as the data returned by pytrends API into a pandas dataframe. This will make it ease to format and explore the data.
import pandas as pd
from pytrends.request import TrendReq

pytrends = TrendReq()
The pytrends API has about nine methods. For my example I’ll be using the following:
- Interest Over Time: returns historical, indexed data for when the keyword was searched most as shown on Google Trends’ Interest Over Time section.
- Interest by Region: returns data for where the keyword is most searched as shown on Google Trends’ Interest by Region section.
- Related Queries: returns data for the related keywords to a provided keyword shown on Google Trends’ Related Queries section.
- Suggestions: returns a list of additional suggested keywords that can be used to refine a trend search.
Let’s now explore these APIs using the Databases as the main topic of investigation and examining some of the different products. I’ve used the db-engines.com website to select the top 5 databases (as per date of this blog post). These were:
- Oracle
- MySQL
- SQL Server
- PostgreSQL
- MongoDB
I will use this list to look for number of searches and other related information. First thing is to import the necessary libraries and create the connection to Google Trends.
import pandas as pd
from pytrends.request import TrendReq

pytrends = TrendReq()
Next setup the payload and keep the timeframe for searches to the past 12 months only.
search_list = ["Oracle", "MySQL", "SQL Server", "PostgreSQL", "MongoDB"] #max of 5 values allowed
pytrends.build_payload(search_list, timeframe='today 12-m')
We can now look at the the interest over time method to see the number of searches, based on a ranking where 100 is the most popular.
df_ot = pd.DataFrame(pytrends.interest_over_time()).drop(columns='isPartial')
df_ot

and to see a breakdown of these number on an hourly bases you can use the get_historical_interest method.
pytrends.get_historical_interest(search_list)
Let’s move on to exploring the level of interest/searches by country. The following retrieves this information, ordered by Oracle (in decending order) and then select the top 20 countries. Here we can see the relative number of searches per country. Note these doe not necessarily related to the countries with the largest number of searches
df_ibr = pytrends.interest_by_region(resolution='COUNTRY') # CITY, COUNTRY or REGION
df_ibr.sort_values('Oracle', ascending=False).head(20)

Visualizing data is always a good thing to do as we can see a patterns and differences in the data in a clearer way. The following takes the above query and creates a stacked bar chart.
import matplotlib
from matplotlib import pyplot as plt

df2 = df_ibr.sort_values('Oracle', ascending=False).head(20)

df2.reset_index().plot(x='geoName', y=['Oracle', 'MySQL', 'SQL Server', 'PostgreSQL', 'MongoDB'], kind ='bar', stacked=True, title="Searches by Country")

plt.rcParams["figure.figsize"] = [20, 8]
plt.xlabel("Country")
plt.ylabel("Ranking")

We can delve into the data more, by focusing on one particular country and examine the google searches by city or region. The following looks at the data from USA and gives the rankings for the various states.
pytrends.build_payload(search_list, geo='US')
df_ibr = pytrends.interest_by_region(resolution='COUNTRY', inc_low_vol=True)
df_ibr.sort_values('Oracle', ascending=False).head(20)

df2.reset_index().plot(x='geoName', y=['Oracle', 'MySQL', 'SQL Server', 'PostgreSQL', 'MongoDB'], kind ='bar', stacked=True, title="test")
plt.rcParams["figure.figsize"] = [20, 8]

plt.title("Searches for USA")
plt.xlabel("State")
plt.ylabel("Ranking")


We can find the top related queries and and top queries including the names of each database.
search_list = ["Oracle", "MySQL", "SQL Server", "PostgreSQL", "MongoDB"] #max of 5 values allowed
pytrends.build_payload(search_list, timeframe='today 12-m')

rq = pytrends.related_queries()
rq.values()

#display rising terms
rq.get('Oracle').get('rising')
We can see the top related rising queries for Oracle are about tik tok. No real surprise there!

and the top queries for Oracle included:
rq.get('Oracle').get('top')

This was an interesting exercise to do. I didn’t show all the results, but when you explore the other databases in the list and see the results from those, and then compare them across the five databases you get to see some interesting patterns.

You must be logged in to post a comment.