
Data Profiling in Python
With every data analytics and data science project, one of the first tasks to that everyone needs to do is to profile the data sets. Data profiling allows you to get an initial picture of the data set, see data distributions and relationships. Additionally it allows us to see what kind of data cleaning and data transformations are necessary.
Most data analytics tools and languages have some functionality available to help you. Particular the various data science/machine learning products have this functionality built-in them and can do a lot of the data profiling automatically for you. But if you don’t use these tools/products, then you are probably using R and/or Python to profile your data.
With Python you will be working with the data set loaded into a Pandas data frame. From there you will be using various statistical functions and graphing functions (and libraries) to create a data profile. From there you will probably create a data profile report.
But one of the challenges with doing this in Python is having different coding for handling numeric and character based attributes/features. The describe function in Python (similar to the summary function in R) gives some statistical summaries for numeric attributes/features. A different set of functions are needed for character based attributes. The Python Library repository (https://pypi.org/) contains over 200K projects. But which ones are really useful and will help with your data science projects. Especially with new projects and libraries being released on a continual basis? This is a major challenge to know what is new and useful.
For example the followings shows loading the titanic data set into a Pandas data frame, creating a subset and using the describe function in Python.
import pandas as pd

df = pd.read_csv("/Users/brendan.tierney/Dropbox/4-Datasets/titanic/train.csv")

df.head(5)

df2 = df.iloc[:,[1,2,4,5,6,7,8,10,11]]
df2.head(5)

df2.describe()

You will notice the describe function has only looked at the numeric attributes.
One of those 200+k Python libraries is one called pandas_profiling. This will create a data audit report for both numeric and character based attributes. This most be good, Right? Let’s take a look at what it does.
For each column the following statistics – if relevant for the column type – are presented in an interactive HTML report:
- Essentials: type, unique values, missing values
- Quantile statistics like minimum value, Q1, median, Q3, maximum, range, interquartile range
- Descriptive statistics like mean, mode, standard deviation, sum, median absolute deviation, coefficient of variation, kurtosis, skewness
- Most frequent values
- Histogram
- Correlations highlighting of highly correlated variables, Spearman, Pearson and Kendall matrices
- Missing values matrix, count, heatmap and dendrogram of missing values
The first step is to install the pandas_profiling library.
pandas-profiling package naming was changed. To continue profiling data use ydata-profiling instead!
pip3 install pandas_profiling
Now run the pandas_profiling report for same data frame created and used, see above.
import pandas_profiling as pp

df2.profile_report()
The following images show screen shots of each part of the report. Click and zoom into these to see more details.


Always watching, always listening. Be careful with your data
The saying ‘Big Brother is Watching’ has been around a long time and typically gets associated with government organisations. But over the past few years we have a few new Big Brothers appearing. These are in the form of Google and Facebook and a few others.
These companies gather lots and lots. Some companies gather enormous amounts of data. This data will include details of your interactions with the companies through various websites, applications, etc. But some are gathering data in ways that you might not be aware. For example, take this following video. Data is being gathered about what you do and where you go even if you have disconnected your phone.
Did you know this kind of data was being gathered about you?
Just think of what they could be doing with that data, that data you didn’t know they were gathering about you. Companies like these generate huge amounts of income from selling advertisements and the more data they have about individuals the more the can understand what they might be interested. The generate customer profiles and sell expensive advertising based on having these very detailed customer profiles.
But it doesn’t stop there. Recently Google bought Fitbit. Just think about what they can do now. Combining their existing profiles of you as a person with you activities throughout every day, week and month. Just think about how various health and insurance companies would love to have this data. Yes they would and companies like Google would be able to charge these companies even more money for this level of detail on individuals/customers.
But it doesn’t stop there. There have been lots of reports of various apps sharing health and other related data with various companies, without their customers being aware this is happening.
What about Google Assistant? In a recent article by MIT Technology Review title Inside Amazon’s plan for Alexa to run your entire life, they discuss how Alexa can be used to control virtually everything. In this article Alexa’s cheif scientist say “plan is for the voice assistant to move from passive to proactive interactions. Rather than wait for and respond to requests, Alexa will anticipate what the user might want. The idea is to turn Alexa into an omnipresent companion that actively shapes and orchestrates your life. This will require Alexa to get to know you better than ever before.” When combined with other products this will allow “these new products let Alexa listen to and log data about a dramatically larger portion of your life“.
Just imagine if Google did the same with their Google Assistant! Big Brother isn’t just Watching, they are also Listening!
There has been some recent report of Google looking to get into Banking by offering checking accounts. The project, code-named Cache, is due to launch in 2020. Google has partnered with Citigroup and a credit union at Stanford University, which will administer the accounts. Users will be able to access their accounts through Google’s digital payment platform, Google Pay.
And there are the reports of Google having access to the health records of over 50 million people. In addition to this, Google has signed a deal with Ascension, the second-largest hospital system in the US, to collect and analyze millions of Americans’ personal health data. Ascension operates in 150 hospitals in 21 states.
What if they also had access to your banking details and spending habits? Google is looking at different options to extend financial products from the google pay into more main stream banking. There has been some recent report of them looking at offering current accounts.
I won’t go discussing their attempts at Ethics and their various (failed) attempts at establishing and Ethics Advisory Board. This has been well documented elsewhere.
Things are getting a bit scary and the saying ‘Big Brother is Watching You’, is very, very true.
In the ever increasing connected world, all of us have a responsibility to know what data companies are gathering on us. We need to decide how comfortable we are with this and if you aren’t then you need to take steps to ensure you protect yourself. Maybe part of this protection requires us to become less connected, stop using some apps, turn off more notification, turn off updates, turn off tracking, etc
While taking each product or offering individually, it may seem ok to us for Google and other companies to offer such services and to analyze our data to provide a better service. But for most people the issues arise when each of these products start to be combined. By doing this they get to have greater access and understanding our our data and our behaviors. What role does (digital) ethics play in all of this? This is something for the company and the employees to decide where things should stop. But when/how do you decide this? when do you/they know things have gone too far? how can you undo some of this work to go back to an acceptable level? what is an acceptable level and how do you define this?
As yo can see there are lots of things to consider and a vital component is the role of (digital) ethics. All organizations who process and analyze data need to have an ethics board and ethics needs to be a core part of every project. To support this everyone needs more training and awareness of ethics and what is acceptable or not.
Demographics vs Psychographics for Machine Learning
When preparing data for data science, data mining or machine learning projects you will create a data set that describes the various characteristics of the subject or case record. Each attribute will contain some descriptive information about the subject and is related to the target variable in some way.
In addition to these attributes, the data set will be enriched with various other internal/external data to complete the data set.
Some of the attributes in the data set can be grouped under the heading of Demographics. Demographic data contains attributes that explain or describe the person or event each case record is focused on. For example, if the subject of the case record is based on Customer data, this is the “Who” the demographic data (and features/attributes) will be about. Examples of demographic data include:
- Age range
- Marital status
- Number of children
- Household income
- Occupation
- Educational level
These features/attributes are typically readily available within your data sources and if they aren’t then these name be available from a purchased data set.
Additional feature engineering methods are used to generate new features/attributes that express meaning is different ways. This can be done by combining features in different ways, binning, dimensionality reduction, discretization, various data transformations, etc. The list can go on.
The aim of all of this is to enrich the data set to include more descriptive data about the subject. This enriched data set will then be used by the machine learning algorithms to find the hidden patterns in the data. The richer and descriptive the data set is the greater the likelihood of the algorithms in detecting the various relationships between the features and their values. These relationships will then be included in the created/generated model.
Another approach to consider when creating and enriching your data set is move beyond the descriptive features typically associated with Demographic data, to include Pyschographic data.
Psychographic data is a variation on demographic data where the feature are about describing the habits of the subject or customer. Demographics focus on the “who” while psycographics focus on the “why”. For example, a common problem with data sets is that they describe subjects/people who have things in common. In such scenarios we want to understand them at a deeper level. Psycographics allows us to do this. Examples of Psycographics include:
- Lifestyle activities
- Evening activities
- Purchasing interests – quality over economy, how environmentally concerned are you
- How happy are you with work, family, etc
- Social activities and changes in these
- What attitudes you have for certain topic areas
- What are your principles and beliefs
The above gives a far deeper insight into the subject/person and helps to differentiate each subject/person from each other, when there is a high similarity between all subjects in the data set. For example, demographic information might tell you something about a person’s age, but psychographic information will tell you that the person is just starting a family and is in the market for baby products.
I’ll close with this. Consider the various types of data gathering that companies like Google, Facebook, etc perform. They gather lots of different types of data about individuals. This allows them to build up a complete and extensive profile of all activities for individuals. They can use this to deliver more accurate marketing and advertising. For example, Google gathers data about what places to visit throughout a data, they gather all your search results, and lots of other activities. They can do a lot with this data. but now they own Fitbit. Think about what they can do with that data and particularly when combined with all the other data they have about you. What if they had access to your medical records too! Go Google this ! You will find articles about them now having access to your health records. Again combine all of the data from these different data sources. How valuable is that data?
Oracle Magazine articles
Over the past few weeks I’ve had a couple of articles published with Oracle Magazine and these can be viewed on their website.
The first article is titled ‘Quickly Create Charts and Graphs of You Query Data‘ using Oracle Machine Learning Notebooks.

The second article is titled ‘REST-Enabling Oracle Machine Learning Models‘.
Click on the above links to check out those articles and check out the Oracle Magazine website for lots more articles and content.
There will be a few more Oracle Magazine articles coming out over the next few months.
Creating a VM on Oracle Always Free
I’m going to create a new Cloud VM to host some of my machine learning work. The first step is to create the VM before installing the machine learning software.
That’s what I’m going to do in this blog post and the next blog post. In this blog post I’ll step through how to setup the VM using the Oracle Always Free cloud offering. In the next I’ll go through the machine learning software install and setup.
Step 1 – Create a ssh key/file
Whatever your preferred platform for your day to day computer there will be software available for you to generate a ssh key file. You will need this when creating the VM and for when you want to login in to VM on the command line. My day-to-day workhorse is a Mac, and I used the following command to create the ssh key file.
ssh-keygen -t rsa -N "" -b 2048 -C "myOracleCloudkey" -f myOracleCloudkey
Step 2 – Login and Select create VM
Log into your Oracle Cloud Always Free account.

Select Create a VM Instance.

Step 3 – Configure the VM
Give the instance a name. I called mine ‘b01-vm-1‘
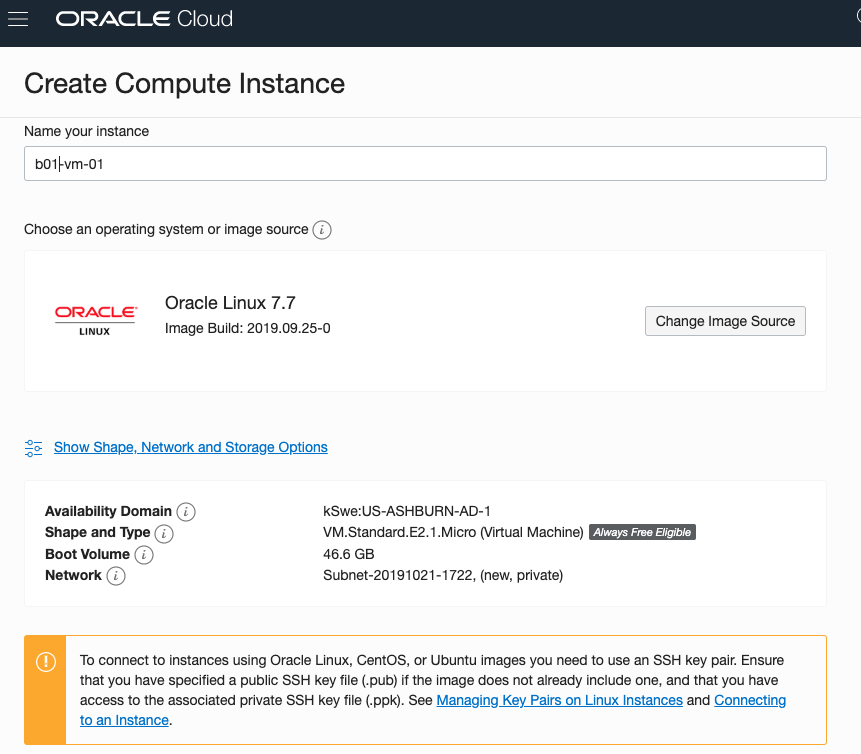
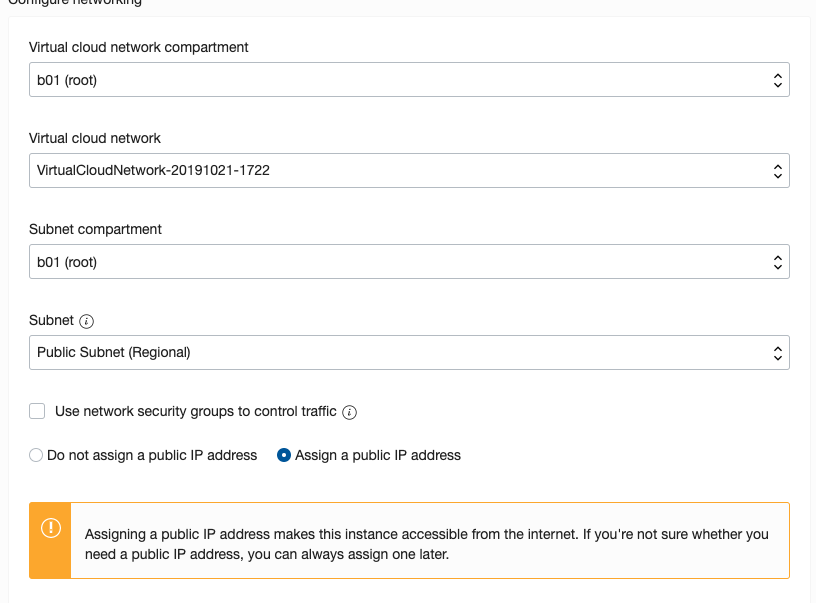
Expand the networks section by clicking on Show Shape, Network and Storage Options. Set the IP address to be public.
Scroll down to the ssh section. Select the ssh file you created earlier.
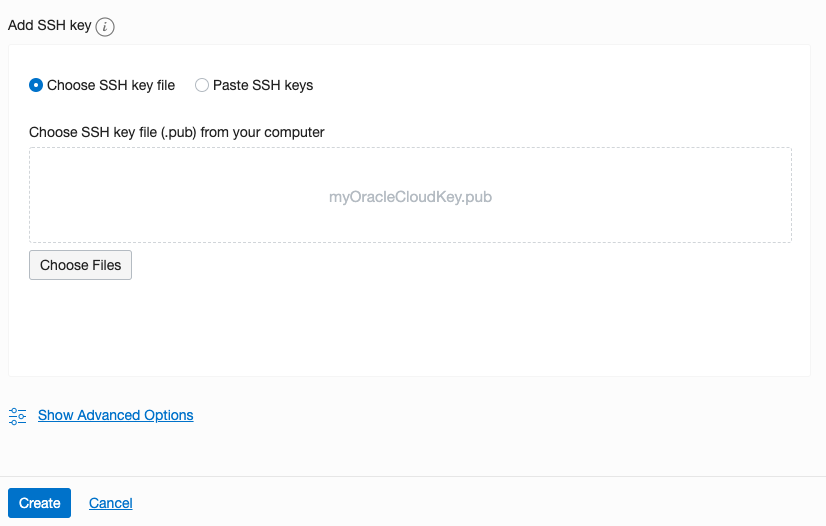
Click on the Create button.
That’s it, all done. Just wait for the VM to be created. This will takes a few seconds.
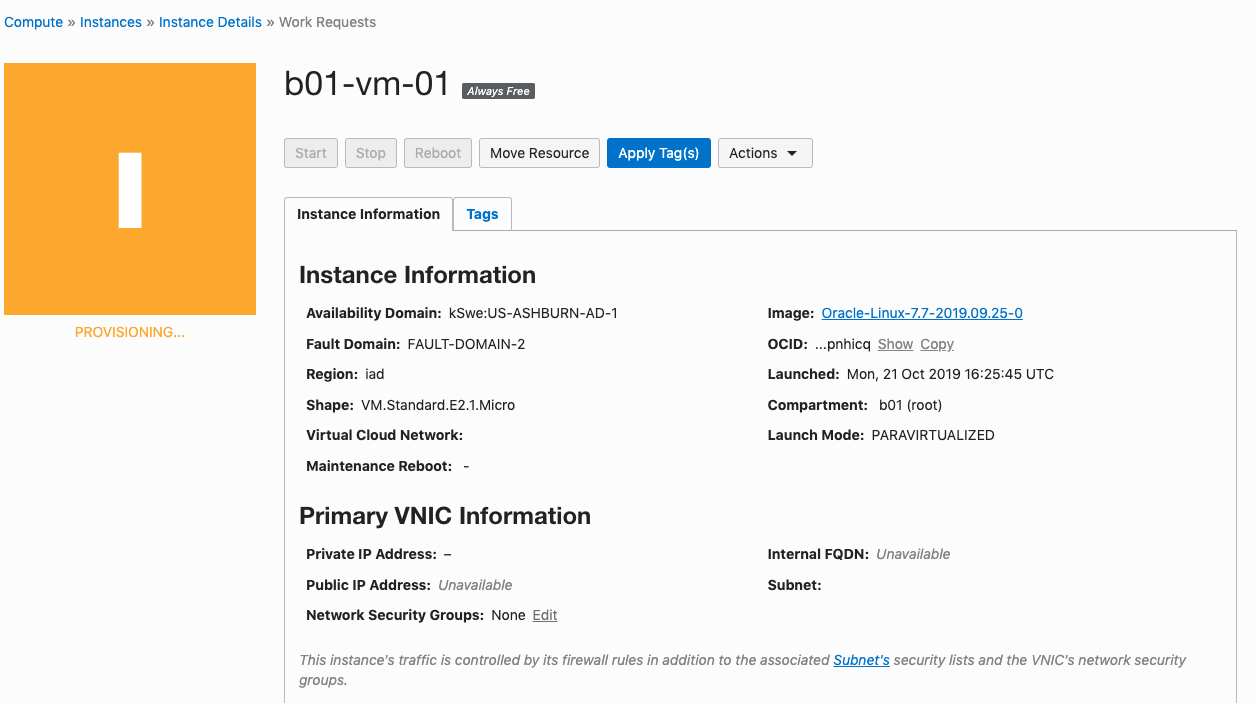
After the VM is created the IP address will be listed on this screen. Take note of it.
Step 4 – Connect and log into the VM
We can not log into the VM using ssh, to prove that it exists, using the command
ssh -i <name of ssh file> opc@<ip address of VM>
When I use this command I get the following:
ssh -i XXXXXXXXXX opc@XXX.XXX.XXX.XXX
The authenticity of host 'XXX.XXX.XXX.XXX (XXX.XXX.XXX.XXX)' can't be established.
ECDSA key fingerprint is SHA256:fX417Z1yFoQufm7SYfxNi/RnMH5BvpvlOb2gOgnlSCs.
Are you sure you want to continue connecting (yes/no)? yes
Warning: Permanently added 'XXX.XXX.XXX.XXX' (ECDSA) to the list of known hosts.
Enter passphrase for key 'XXXXXXXXXX':
[opc@b1-vm-01 ~]$ pwd
/home/opc

[opc@b1-vm-01 ~]$ df
Filesystem   1K-blocks     Used Available Use%  Mounted on
devtmpfs        469092        0    469092   0%  /dev
tmpfs           497256        0    497256   0%  /dev/shm
tmpfs           497256     6784    490472   2%  /run
tmpfs           497256        0    497256   0%  /sys/fs/cgroup
/dev/sda3     40223552  1959816  38263736   5%  /
/dev/sda1       204580     9864    194716   5%  /boot/efi
tmpfs            99452        0     99452   0%  /run/user/1000
And there we have it. A VM setup on Oracle Always Free.
Next step is to install some Machine Learning software.
Changing PDB/CDB spfile parameters
When working with a Oracle database hosted on the Oracle cloud (not an Autonomous DB), I recently had the need to change/increase the number of processes for the database. After a bit of researching it looked liked I just had to make the change to the SPFILE and that would be it.
I needed to change/increase the PROCESSES parameter for the CDB and the PDB. Following the multitude of advice on the internet, I ssh into the DB server, found the SPFILE and changed it.
I bounced the DB and when I connected to the PDB, I found the number for PROCESSES was still the same as the old/original value. Nothing had changed.
By default the initialization parameter for the PDB inherit the values from the parameters for the CDB. But this didn’t seem to be the case.
After a bit more research, I needed to set this parameter for the CDB and the PDB. But no luck finding a parameter file for the PDB. It turns out the parameters for the PDB are set at the metadata level, and I needed to change the parameter there.
What I had to do was to change the value when connected to it using SQL*Plus, SQL Dev etc. So, How did I change the parameter value.
Using SQL Developer as my tool, I connected as SYSDBA to my PDB. Then ran,
alter session set container = cdb$root
Now change the parameter value.
alter system set processes = 1200 scope=both
I then bounced the database, logged back into my PDB as system and checked the parameter values. It worked. This was such a simple solution and it worked for me, but there was way too many articles, blog posts, etc out there that didn’t work. Something I’ll need to investigate later is, did I need to connect to the CDB? could I have just run the second command only? I need to setup a different/test DB and see.
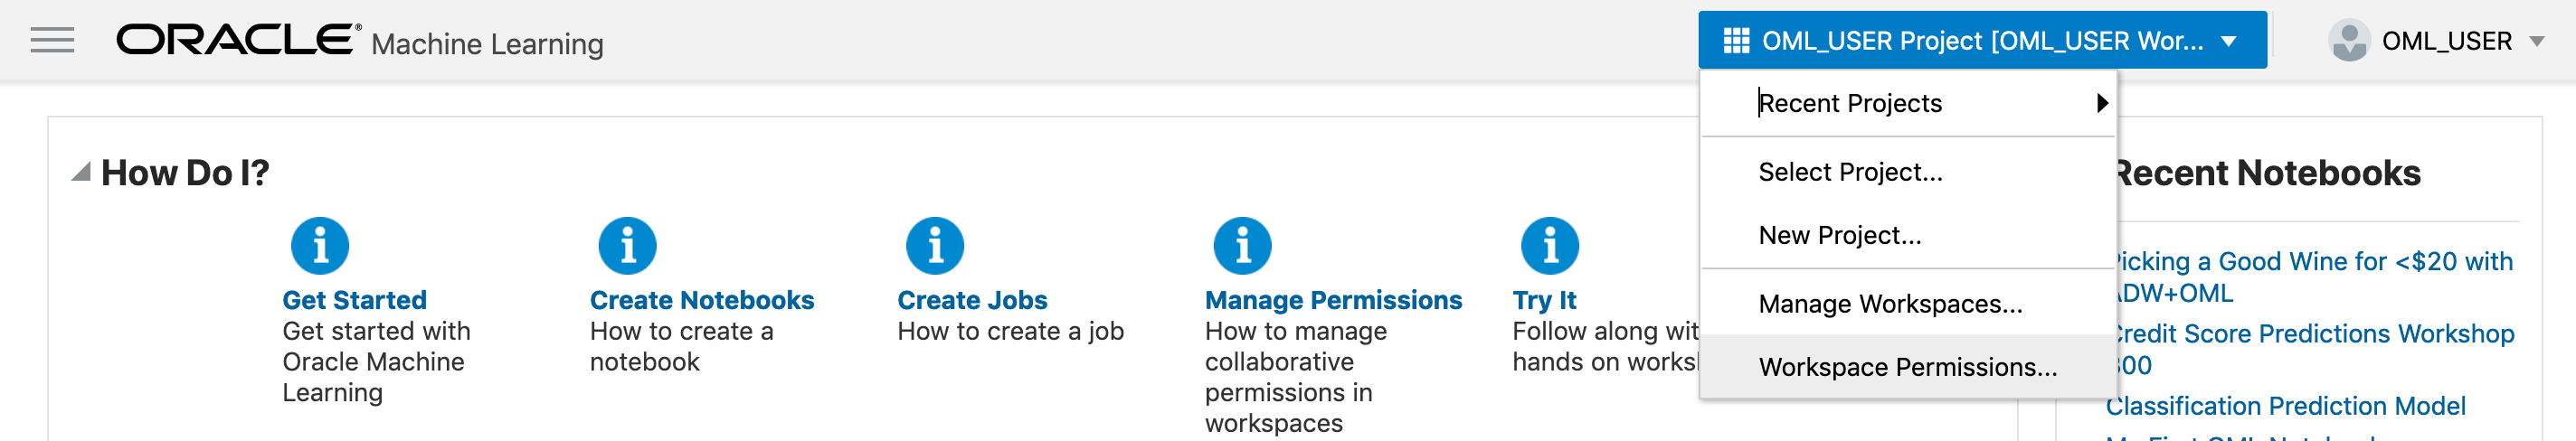
OML Workspace Permissions
When working with Oracle Machine Learning (OML) you are creating notebooks which focus on a particular data exploration and possibly some machine learning. Despite it’s name, OML is used extensively for data discovery and data exploration.
One of the aims of using OML, or notebooks in general, is that these can be easily shared with other people either within the same team or beyond. Something to consider when sharing notebooks is what you are allowing other people do with your notebook. Without any permissions you are allowing people to inspect, run and modify the notebooks. This can be a problem because those people you are sharing with may or may not be allowed to make modification. Some people should be able to just view the notebook, and others should be able to more advanced tasks.
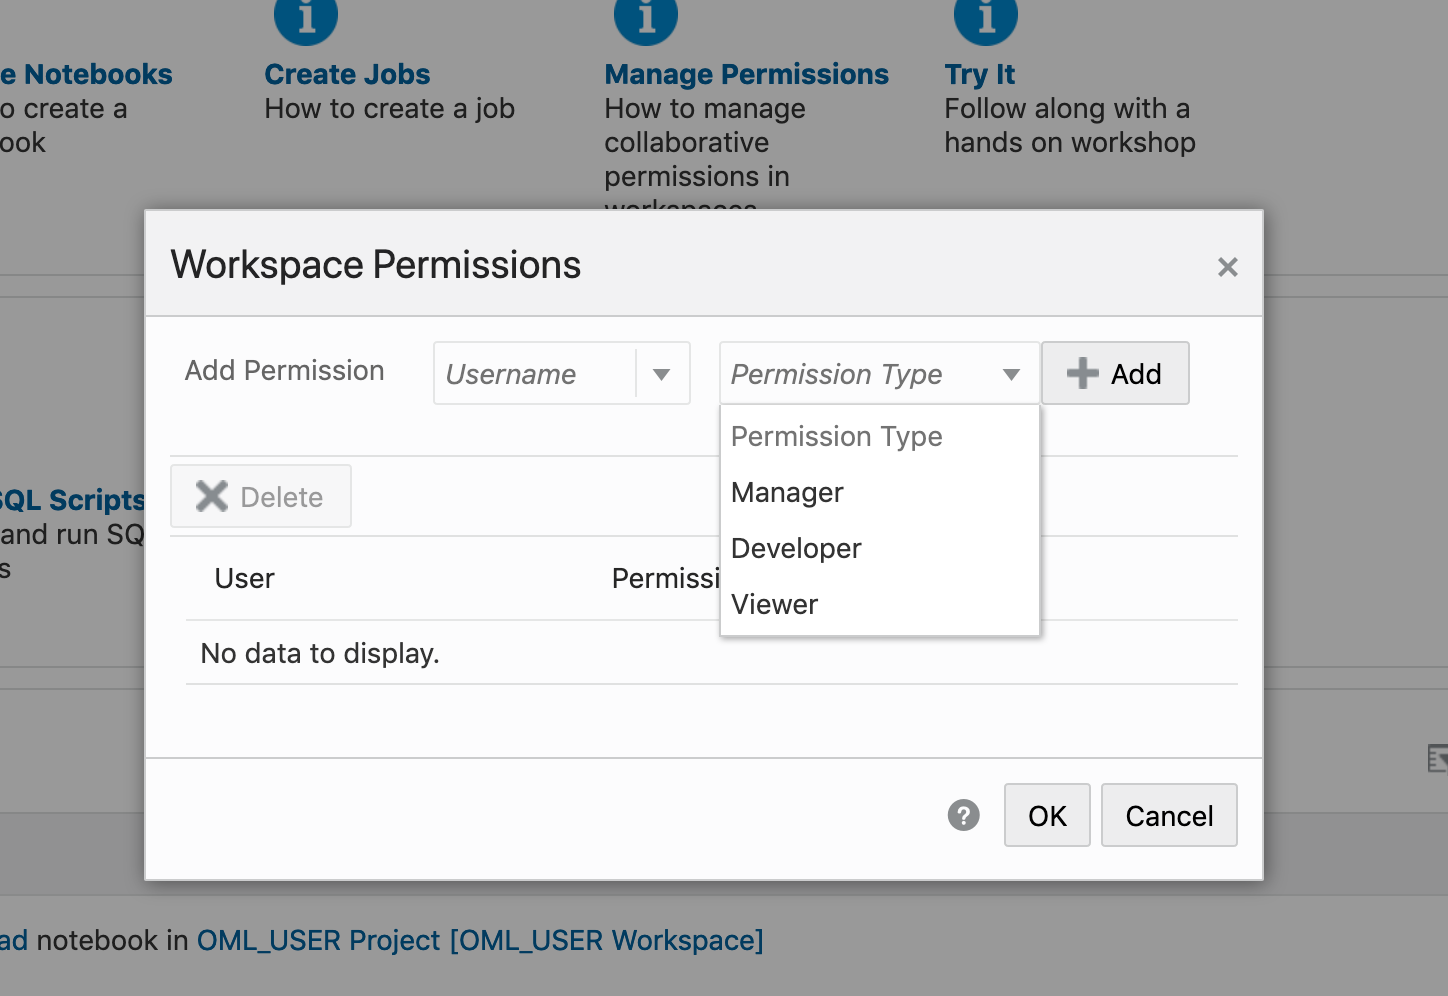
With OML Notebooks there are four primary types of people who can access Notebooks and these can have different privileges. These are defined as
- Developer : Can create new notebooks withing a project and workspace but cannot create a workspace or a project. Can create and run a notebook as a scheduled job.
- Viewer : They can just view projects, Workspaces and notebooks. They are not allowed to create or run anything.
- Manager : can create new notebooks and projects. But only view Workspaces. Additionally they can schedule notebook jobs.
- Administrators : Administrators of the OML environment do not have any edit capabilities on notebooks. But they can view them.
OML Notebooks Interpreter Bindings
When using Oracle Machine Learning notebooks, you can export and import these between different projects and different environments (from ADW to ATP).
But something to watch out for when you import a notebook into your ADW or ATP environment is to reset the Interpreter Bindings.
When you create a new OML Notebook and build it up, the various Interpreter Bindings are automatically set or turned on. But for Imported OML Notebooks they are not turned on.
I’m assuming this will be fixed at some future point.
If you import an OML Notebook and turn on the Interpreter Bindings you may find the code in your notebook cells running very slowly
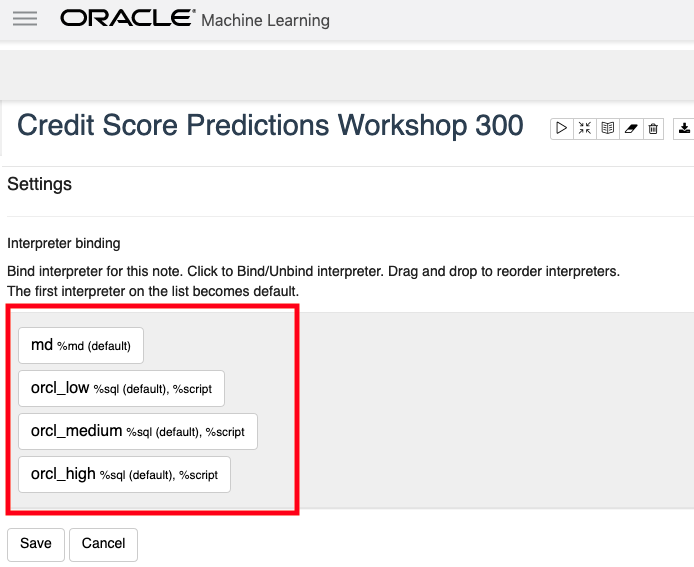
To turn on these binding, click on the options icon as indicated by the red box in the following image.
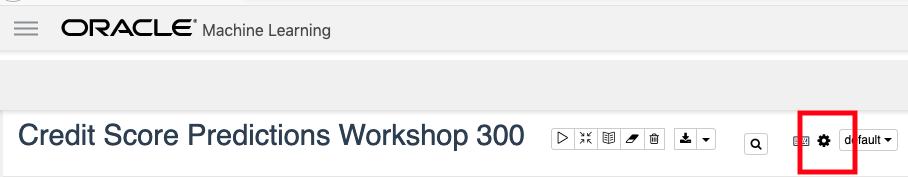
You will get something like the following being displayed. None of the bindings are highlighted.
To enable the Interpreter Bindings just click on each of these boxes. When you do this each one will be highlighted and will turn a blue color.
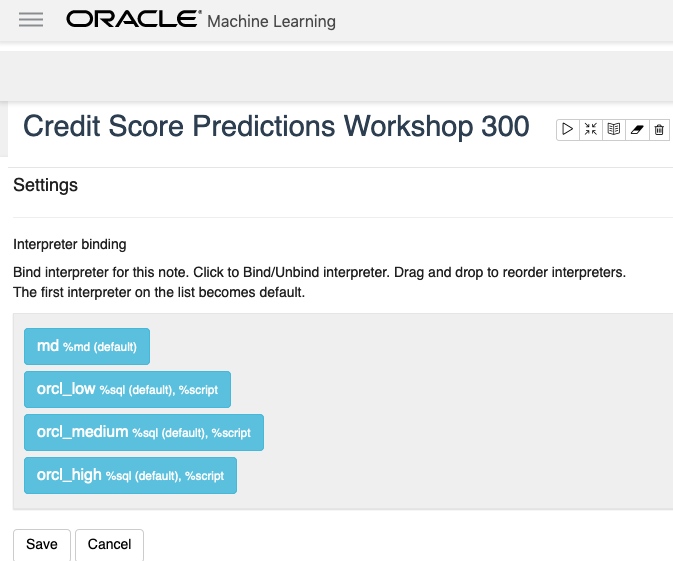
All done! You can now run your OML Notebooks without any problems or delays.
ADW – Loading data using Object Storage
There are a number of different ways to load data into your Autonomous Data Warehouse (ADW) environment. I’ll have posts about these alternatives.
In this blog post I’ll go through the steps needed to load data using Object Storage. This might appear to have a large-ish number of steps, but once you have gone through it and have some of the parts already setup and configuration from your first time, then the second and subsequent times will be easier.
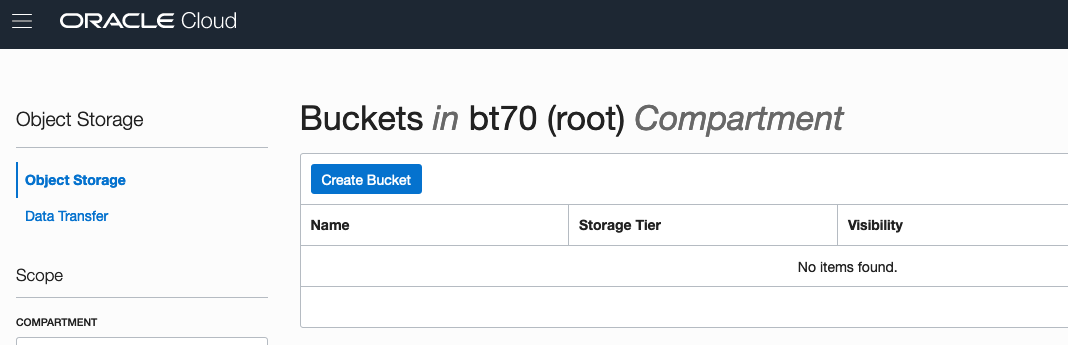
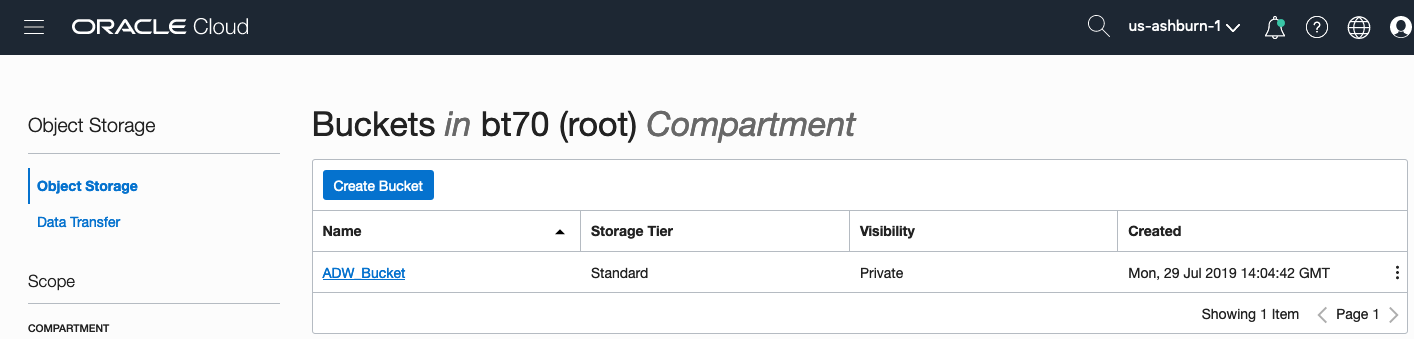
After logging into your Oracle Cloud dashboard, select Object Storage from the side menu.

Then click on the Create Bucket button.
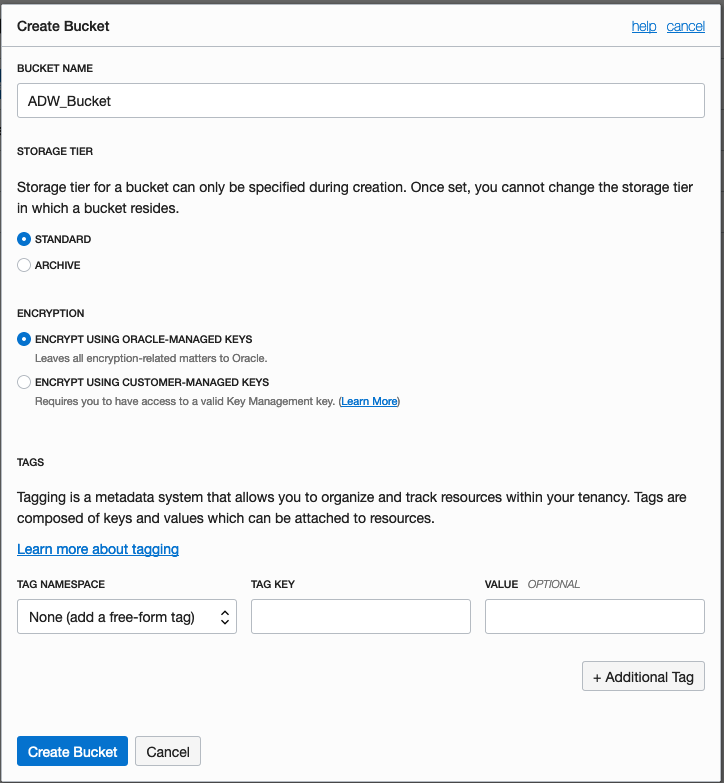
Enter a name for the Object Storage bucket, take the defaults for the for the rest, and click on the Create Bucket button at the bottom. In my example, I’ve called the bucket ‘ADW_Bucket’.
Click on the name of the bucket in the list.
And then click Upload Objects button.

In the Upload Objects window, browse for the file(s) you want to upload.


Then click on the Upload Objects button on the Upload Objects window. After a few moments you will see a message saying the file(s) have been uploaded. Click on the Close window.

Click into the Object details and take a note/copy of the URL Path. You will need this later
To load data from the Oracle Cloud Infrastructure(OCI) Object Storage you will need an OCI user with the appropriate privileges to read data (or upload) data to the Object Store. The communication between the database and the object store relies on the Swift protocol and the OCI user Auth Token. Go back to the menu in the upper left and select users.


Then click on the user name to view the details. This is probably your OCI username.
On the left hand side of the page click Auth Tokens, and then click on Generate Token button. Give a name for the token e.g ADW_TOKEN, and then generate token.

Save the generated token to use later.

Open SQL Developer and setup a connection to your OML User/schema. When connected the next steps is to authenticate with the Object storage using your OCI username and the Auth Token, generated above.
BEGIN
  DBMS_CLOUD.CREATE_CREDENTIAL(
    credential_name => 'ADW_TOKEN',
    username => '<your cloud username>',
    password => '<generated auth token>'
  );
END;
If successful you should get the following message. If not then you probably entered something incorrectly. Go back and review the previous steps
PL/SQL procedure successfully completed.
Next, create a table to store the data you want to import. For my table the create table is the following. [It is one of the sample data sets for OML, and I’ve made the create table statement compact to save space in this post]
create table credit_scoring_100k
( customer_id number(38,0), age number(4,0), income number(38,0), marital_status varchar2(26 byte),
number_of_liables number(3,0), wealth varchar2(4000 byte), education_level varchar2(26 byte),
tenure number(4,0), loan_type varchar2(26 byte), loan_amount number(38,0),
loan_length number(5,0), gender varchar2(26 byte), region varchar2(26 byte),
current_address_duration number(5,0), residental_status varchar2(26 byte),
number_of_prior_loans number(3,0), number_of_current_accounts number(3,0),
number_of_saving_accounts number(3,0), occupation varchar2(26 byte),
has_checking_account varchar2(26 byte), credit_history varchar2(26 byte),
present_employment_since varchar2(26 byte), fixed_income_rate number(4,1),
debtor_guarantors varchar2(26 byte), has_own_phone_no varchar2(26 byte),
has_same_phone_no_since number(4,0), is_foreign_worker varchar2(26 byte),
number_of_open_accounts number(3,0), number_of_closed_accounts number(3,0),
number_of_inactive_accounts number(3,0), number_of_inquiries number(3,0),
highest_credit_card_limit number(7,0), credit_card_utilization_rate number(4,1),
delinquency_status varchar2(26 byte), new_bankruptcy varchar2(26 byte),
number_of_collections number(3,0), max_cc_spent_amount number(7,0),
max_cc_spent_amount_prev number(7,0), has_collateral varchar2(26 byte),
family_size number(3,0), city_size varchar2(26 byte), fathers_job varchar2(26 byte),
mothers_job varchar2(26 byte), most_spending_type varchar2(26 byte),
second_most_spending_type varchar2(26 byte), third_most_spending_type varchar2(26 byte),
school_friends_percentage number(3,1), job_friends_percentage number(3,1),
number_of_protestor_likes number(4,0), no_of_protestor_comments number(3,0),
no_of_linkedin_contacts number(5,0), average_job_changing_period number(4,0),
no_of_debtors_on_fb number(3,0), no_of_recruiters_on_linkedin number(4,0),
no_of_total_endorsements number(4,0), no_of_followers_on_twitter number(5,0),
mode_job_of_contacts varchar2(26 byte), average_no_of_retweets number(4,0),
facebook_influence_score number(3,1), percentage_phd_on_linkedin number(4,0),
percentage_masters number(4,0), percentage_ug number(4,0),
percentage_high_school number(4,0), percentage_other number(4,0),
is_posted_sth_within_a_month varchar2(26 byte), most_popular_post_category varchar2(26 byte),
interest_rate number(4,1), earnings number(4,1), unemployment_index number(5,1),
production_index number(6,1), housing_index number(7,2), consumer_confidence_index number(4,2),
inflation_rate number(5,2), customer_value_segment varchar2(26 byte),
customer_dmg_segment varchar2(26 byte), customer_lifetime_value number(8,0),
churn_rate_of_cc1 number(4,1), churn_rate_of_cc2 number(4,1),
churn_rate_of_ccn number(5,2), churn_rate_of_account_no1 number(4,1),
churn_rate__of_account_no2 number(4,1), churn_rate_of_account_non number(4,2),
health_score number(3,0), customer_depth number(3,0),
lifecycle_stage number(38,0), credit_score_bin varchar2(100 byte));
After creating the table, you are ready to import the data from Object storage. To do this you will need to use the DBMS_COULD PL/SQL package.
begin
   dbms_cloud.copy_data(
   table_name =>'credit_scoring_100k',
   credential_name =>'ADW_TOKEN',
   file_uri_list => '<url of file in your Object Store bucket, see comment earlier in post>',
   format => json_object('ignoremissingcolumns' value 'true', 'removequotes' value 'true', 'dateformat' value 'YYYY-MM-DD HH24:MI:SS', 'blankasnull' value 'true', 'delimiter' value ',', 'skipheaders' value '1')
);
end;
All done.
You can now query the data and use with Oracle Machine Learning, etc.
[I said at the top of the post there are other methods available. More on this in other posts]
Oracle ADW how to load new OML notebooks
Oracle Autonomous Database (ADW) has been out a while now and have had several, behind the scenes, improvements and new/additional features added.
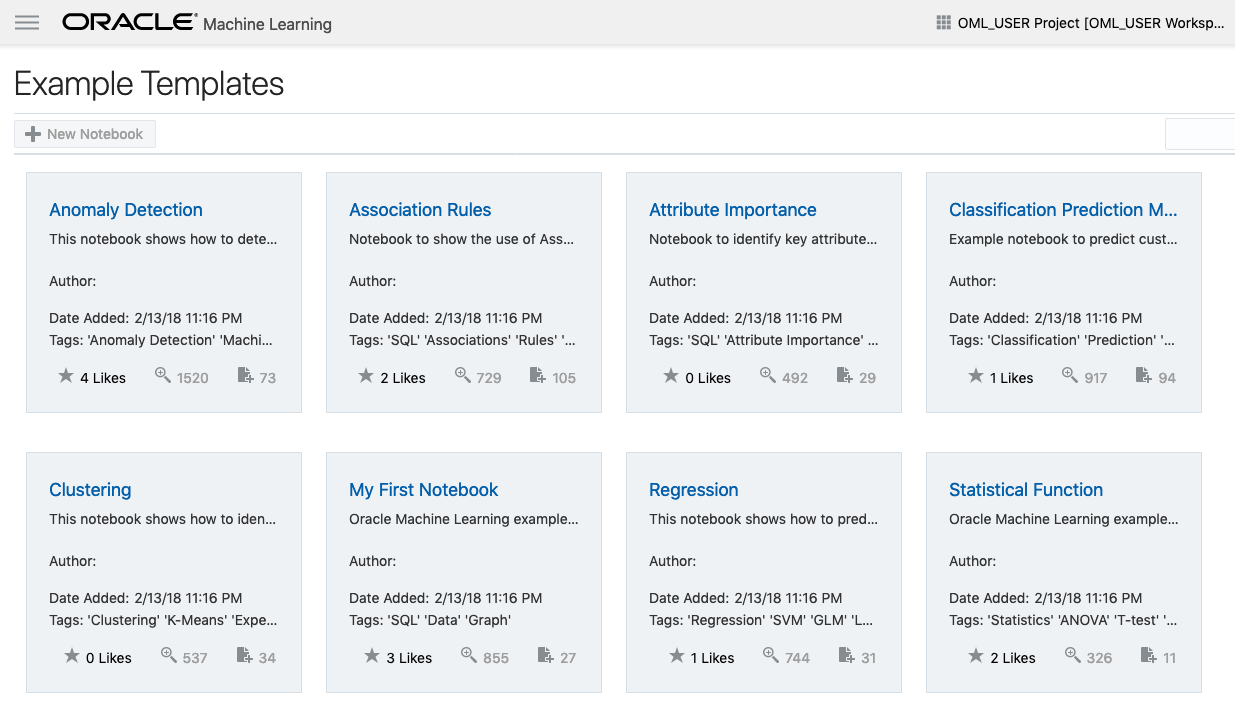
If you have used the Oracle Machine Learning (OML) component of ADW you will have seen the various sample OML Notebooks that come pre-loaded. These are easy to open, use and to try out the various OML features.

The above image shows the top part of the login screen for OML. To see the available sample notebooks click on the Examples icon. When you do, you will get the following sample OML Notebooks.
But what if you have a notebook you have used elsewhere. These can be exported in json format and loaded as a new notebook in OML.
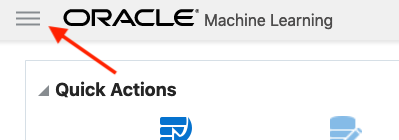
To load a new notebook into OML, select the icon (three horizontal line) on the top left hand corner of the screen. Then select Notebooks from the menu.
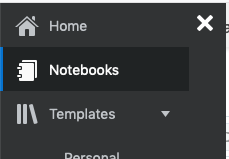
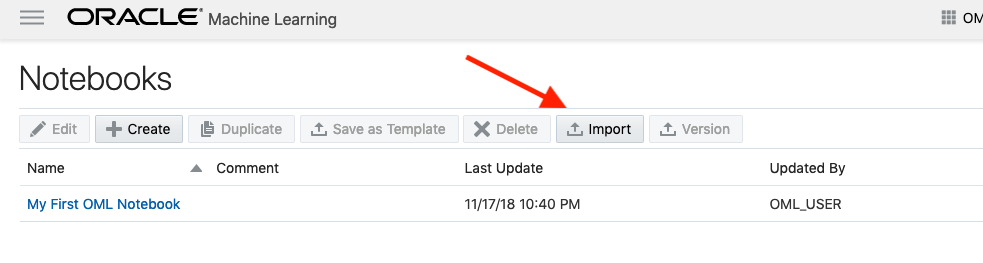
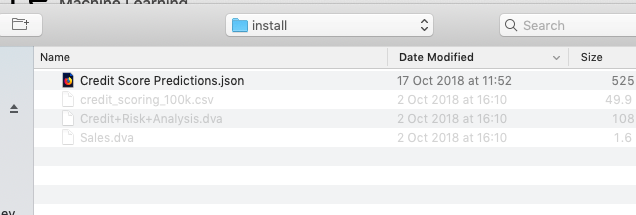
Then select the Import button located at the top of the Notebooks screen. This will open a File window, where you can select the json file from your file system.
A couple of seconds later the notebook will be available and listed along side any other notebooks you may have created.
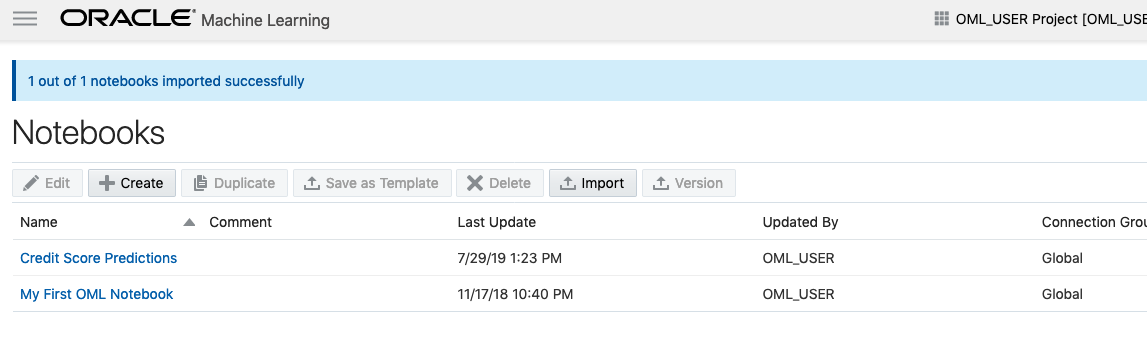
All done!
You have now imported a new notebook into OML and can now use it to process your data and perform machine learning using the in-database features.
Machine Learning on Mobile Devices
You: What? You can’t be serious? Machine Learning on Mobile Devices?
Me: The simple answer is ‘Yes you can!”
You: But, what about all the complex data processing, CPU or GPU, and everything else that is needed for machine learning?
Me: Yes you are correct, those things might not be needed. What’s the answer to everything in IT?
You: It Depends ?
Me: Exactly. Yes It Depends on what you are doing. In most cases you don’t need large amounts of machine processing power to do machine learning. Except if you are doing image processing. Then you do need a bit of power to support that work.
You: But how can a mobile device be used for machine learning?

Me: It Depends! 🙂 It depends on what you are doing. Most of the data processing power needed is for creating the models. That is what most people talk about. Very few people talk about the deployment of machine learning. Deployment, as in, using the machine learning models in your applications.
You: But why mobile devices? That sounds a bit silly?
Me: It does a bit. But when you think about it, how much do you use your mobile phone and tablet? Where else have you seen mobile devices being used?
You: I use these all the time, to do nearly everything. Just like everyone else I know.
Me: Exactly! and where else have you seen mobile devices being used?
You: Everywhere! hotels, bars, shops, hospitals, everywhere!
Me: Exactly. And it kind of makes sense to have machine learning scoring done at the point of capture of the data and not some hours or days or weeks later in some data warehouse or something else.
You: But what about the processing power of these devices. They aren’t powerful enough to run the machine learning models? Or are they?
Me: What is a machine learning model? In a simple way it is a mathematical formula of the data that calculates a particular outcome. Something that is a bit more complicated than using a sum function. Could a mobile device do that easily?
You: Yes. That should be really easy and fast for mobile devices? But machine learning is complex. People keep telling me how complex it is and how difficult it is!
Me: True it can be, but for most problems it can be as simple as writing a few lines of code to create a model. 3-4 lines of code in some languages. But the applying of the the machine learning model can be a simple task (maybe 1 line of code), although some simple data formatting might be needed, but that is a simple task too.
You: So, how can a machine learning model be run on a mobile device?
Me: Programmers write code to run applications on mobile devices. This code can be extended to include the machine learning model. This can be used to score or label the data or do some other processing. A few lines of code. A good alternative is to create a web service to all the remove scoring of the data.
You: The programming languages used for mobile development are a bit different to most other applications. Surely those mobile device languages don’t support machine learning.
Me: You’d be surprised by what’s available.
You: OK, What languages can I try? Where can I get started?
Me: Check out Firebase ML Kit, Apple CoreML and TensorFlow Lite. Those should be more than enough for you to get started with. There are a few others. But start with those.
You. Brilliant, thank you Brendan. I’ll let you know how I get on with those.
GoLang: Inserting records into Oracle Database using goracle
In this blog post I’ll give some examples of how to process data for inserting into a table in an Oracle Database. I’ve had some previous blog posts on how to setup and connecting to an Oracle Database, and another on retrieving data from an Oracle Database and the importance of setting the Array Fetch Size.
When manipulating data the statements can be grouped (generally) into creating new data and updating existing data.
When working with this kind of processing we need to avoid the creation of the statements as a concatenation of strings. This opens the possibility of SQL injection, plus we are not allowing the optimizer in the database to do it’s thing. Prepared statements allows for the reuse of execution plans and this in turn can speed up our data processing and applications.
In a previous blog post I gave a simple example of a prepared statement for querying data and then using it to pass in different values as a parameter to this statement.
dbQuery, err := db.Prepare("select cust_first_name, cust_last_name, cust_city from sh.customers where cust_gender = :1")
if err != nil {
    fmt.Println(err)
    return
}
defer dbQuery.Close()

rows, err := dbQuery.Query('M')
if err != nil {
    fmt.Println(".....Error processing query")
    fmt.Println(err)
    return
}
defer rows.Close()

var CustFname, CustSname,CustCity string
for rows.Next() {
    rows.Scan(&CustFname, &CustSname, &CustCity)
    fmt.Println(CustFname, CustSname, CustCity)
}
For prepared statements for inserting data we can follow a similar structure. In the following example a table call LAST_CONTACT is used. This table has columns:
- CUST_ID
- CON_METHOD
- CON_MESSAGE
_, err := db.Exec("insert into LAST_CONTACT(cust_id, con_method, con_message) VALUES(:1, :2, :3)", 1, "Phone", "First contact with customer")
if err != nil {
    fmt.Println(".....Error Inserting data")
    fmt.Println(err)
    return
}
an alternative is the following and allows us to get some additional information about what was done and the result from it. In this example we can get the number records processed.
stmt, err := db.Prepare("insert into LAST_CONTACT(cust_id, con_method, con_message) VALUES(:1, :2, :3)")
if err != nil {
    fmt.Println(err)
    return
}

res, err := dbQuery.Query(1, "Phone", "First contact with customer")
if err != nil {
    fmt.Println(".....Error Inserting data")
    fmt.Println(err)
    return
}

rowCnt := res.RowsAffected()
fmt.Println(rowCnt, " rows inserted.")
A similar approach can be taken for updating and deleting records
Managing Transactions
With transaction, a number of statements needs to be processed as a unit. For example, in double entry book keeping we have two inserts. One Credit insert and one debit insert. To do this we can define the start of a transaction using db.Begin() and the end of the transaction with a Commit(). Here is an example were we insert two contact details.
// start the transaction
transx, err := db.Begin()
if err != nil {
    fmt.Println(err)
    return
}

// Insert first record
_, err := db.Exec("insert into LAST_CONTACT(cust_id, con_method, con_message) VALUES(:1, :2, :3)", 1, "Email", "First Email with customer")
if err != nil {
    fmt.Println(".....Error Inserting data - first statement")
    fmt.Println(err)
    return
}
// Insert second record
_, err := db.Exec("insert into LAST_CONTACT(cust_id, con_method, con_message) VALUES(:1, :2, :3)", 1, "In-Person", "First In-Person with customer")
if err != nil {
    fmt.Println(".....Error Inserting data - second statement")
    fmt.Println(err)
    return
}

// complete the transaction
err = transx.Commit()
if err != nil {
    fmt.Println(".....Error Committing Transaction")
    fmt.Println(err)
    return
}

You must be logged in to post a comment.